
Gantt Chart
Gantt Chart is a project management visual for Microsoft Power BI that tracks schedules, milestones, and resource workloads.
ChartPadFree
Organizes KPI cards in expandable levels for Power BI reports.
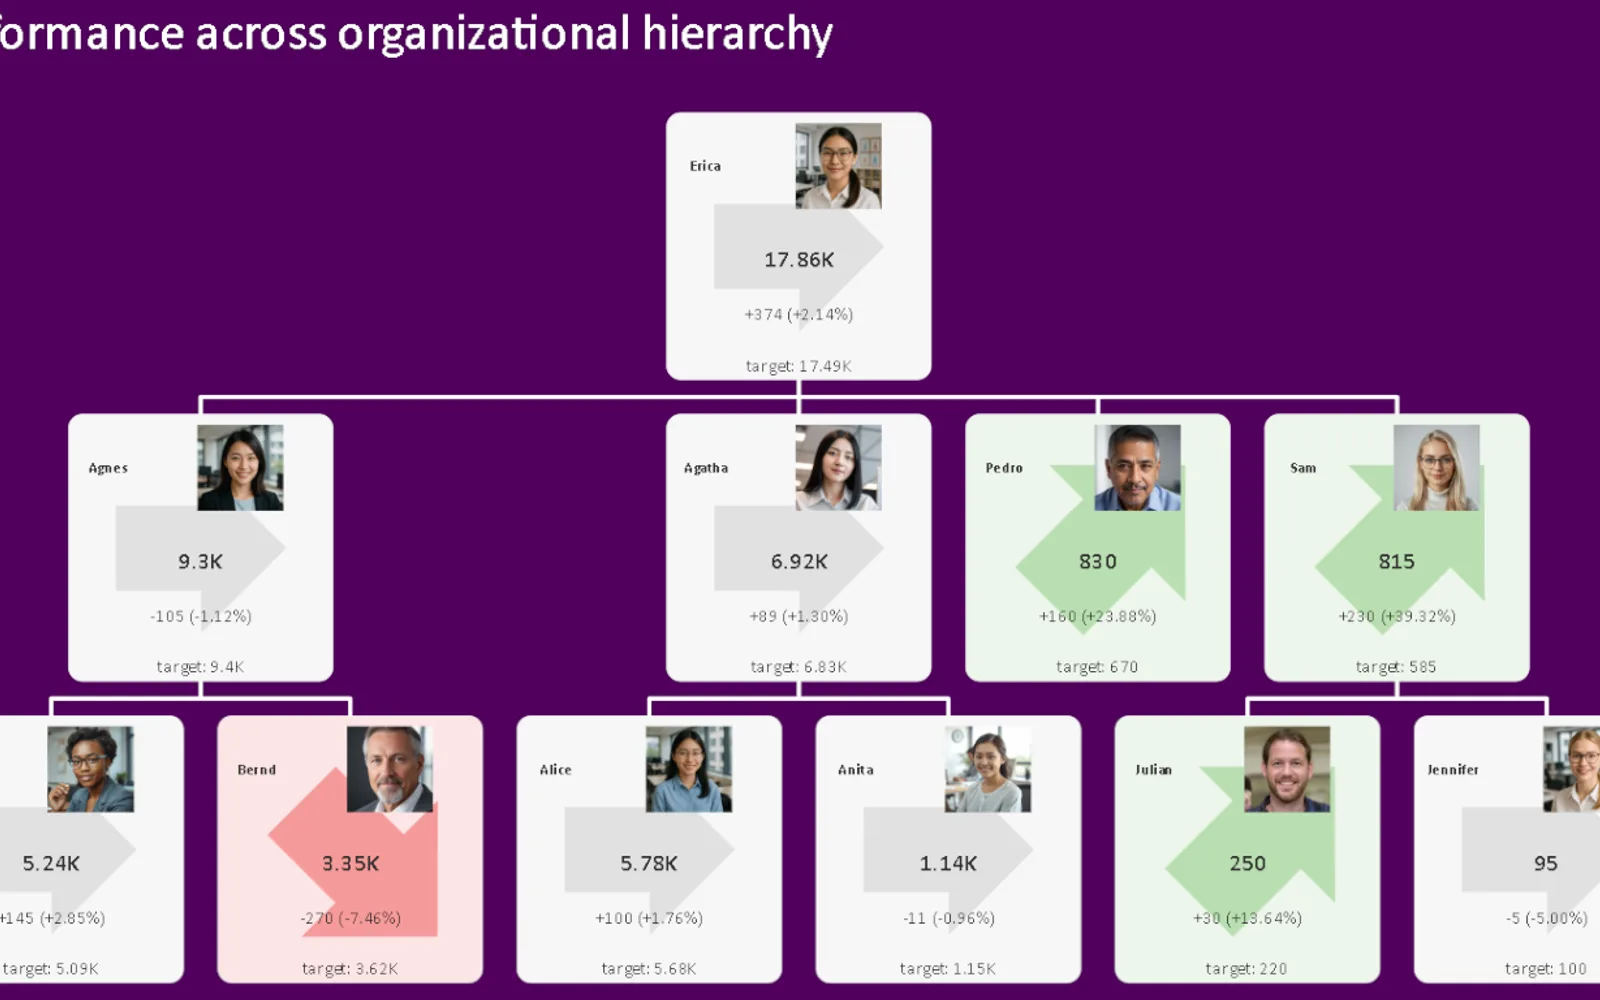
Groups KPI cards into nested levels such as business units, products, regions, or categories. Each card can show two comparable measures, including actual and target values, with an indicator for the difference between them. Small charts can show measure or variance changes over time. Selecting a level can filter or highlight other visuals in a report.
Displays KPI cards across expandable and collapsible levels.
Shows actual and target values or another pair of comparable measures.
Uses directional symbols or configurable icons to represent differences.
Adds small charts for actual, target, or variance values over time.
Allows a selected node to filter or highlight other report visuals.
2,531 plugins in Power BI · Analytics
Price distribution: 125 free, 147 freemium, 1,350 paid, 909 price not published
Gantt Chart is a project management visual for Microsoft Power BI that tracks schedules, milestones, and resource workloads.
ChartPad
Creates visualizations from diverse chart types, combines multiple charts on one canvas, and adds custom annotations and tooltips.
Akvelon
Creates financial and business reports in Power BI with automatic variance calculations, P&L logic, and drill-down (s5, s6).
Zebra BI
AI analysis app for Dynamics 365 Business Central that provides customer KPIs, churn probability, and customer grouping.
Data Courage«KPI Tree is a powerful visual that lets you display multiple KPI cards in an expandable and collapsible hierarchy—perfect for showing how key metrics are distributed and aggregated across organizational structures, product lines, regions, or any multi-level category. Instead of a flat layout or matrix, KPI Tree …»