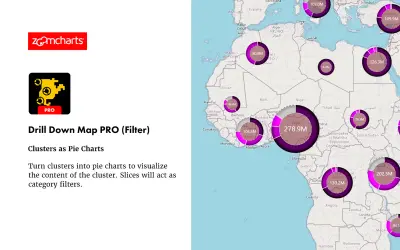
Drill Down Map PRO (Filter) by ZoomCharts
Drill Down Map PRO (Filter) by ZoomCharts visualizes and filters location data on interactive maps for Power BI Desktop reports.
ZoomChartsFreemium
Create custom geography maps in Power BI using GeoJSON or TopoJSON, with routes, markers, charts, and image-based visuals.
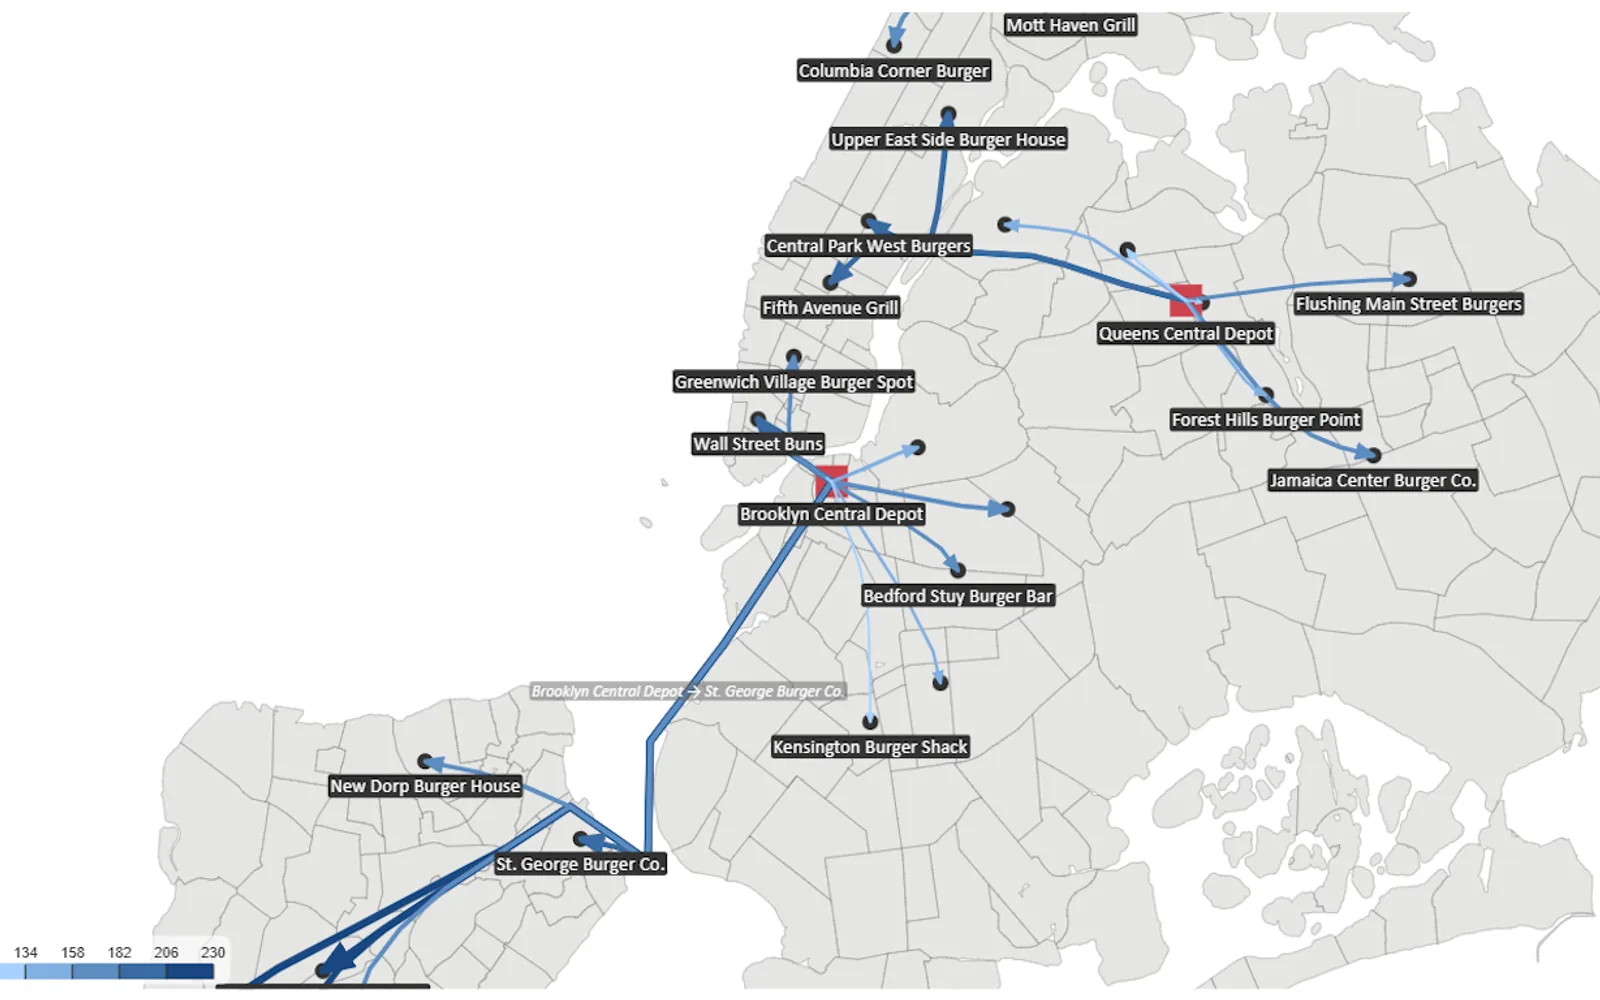
Maps Lite is a Power BI visual for mapping user-supplied GeoJSON or TopoJSON data. It can display colored regions, points, routes, bubbles, images, and small charts on mapped elements. Interaction options include panning, zooming, rotation, drilling, automatic centering, and selection. The visual excludes the offline map library included with the full Maps visual.
Display colored regions, points, routes, bubbles, image markers, and chart-based routes from GeoJSON or TopoJSON.
Show route movement with animated dash patterns.
Place column, pie, or donut charts on points, routes, or custom shapes.
Represent several category values within one location using grouped circles or images.
Use fixed-size images or resize image charts according to a measure.
Support panning, zooming, rotation, drilling, automatic centering, and selection.
Configure category colors, linear or diverging scales, logarithmic scales, multi-field labels, and drill paths.
Provide mapping metadata for preparing data for custom shapes.
Maps Lite is free and cloud-deployed, while Drill Down Map PRO (Filter) by ZoomCharts and Smart Grid-Map are freemium cloud listings, and kml-kmz-visual is paid and cloud-deployed. Synoptic Panel Lite by OKVIZ is also free and cloud-deployed. Maps Lite was updated in Jul 2026, compared with Aug 2026 for Drill Down Map PRO (Filter) by ZoomCharts, Feb 2026 for kml-kmz-visual, Dec 2025 for Smart Grid-Map, Jul 2026 for Synoptic Panel Lite by OKVIZ, and Dec 2025 for Performance Flow - xViz.
| Name | Pricing | Deployment | Updated |
|---|---|---|---|
| this plugin | Free | Cloud | |
| Drill Down Map PRO (Filter) by ZoomCharts | Freemium | Cloud | |
| Smart Grid-Map | Freemium | Cloud | |
| kml-kmz-visual | Paid | Cloud | |
| Synoptic Panel Lite by OKVIZ | Free | Cloud | |
| Performance Flow - xViz | Freemium | Cloud |
657 plugins in Power BI · Analytics
Price distribution: 73 free, 108 freemium, 441 paid, 35 price not published
Drill Down Map PRO (Filter) by ZoomCharts visualizes and filters location data on interactive maps for Power BI Desktop reports.
ZoomCharts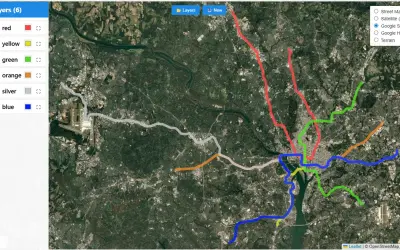
KML/KMZ Viewer renders points, lines, and polygons from KML and KMZ files on interactive maps within Power BI reports.
Abdalla Dabes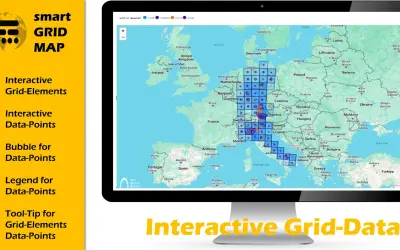
Smart Grid-Map is a custom Power BI visual for visualizing and analyzing grid and raster data with interactive polygons.
The Green Bridge GmbH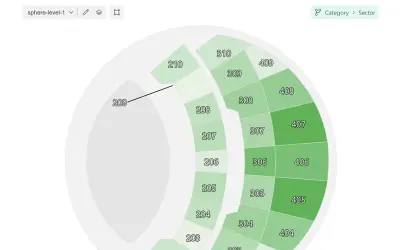
Microsoft-certified Power BI visual for map-based visualizations with multi-level navigation and local map loading.
OKVIZ Corp.«Maps Lite – Your Custom‑Shape Geospatial Power BI Visual Maps Lite is the streamlined version of the widely used Maps visual for Power BI. It offers nearly the full feature set of the original visual, but focuses entirely on scenarios where you bring your own geography. Upload your own GeoJSON or TopoJSON maps and …»