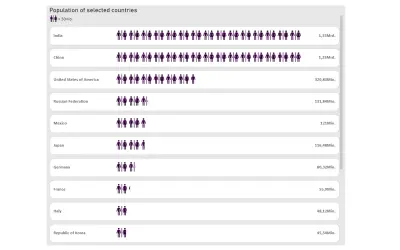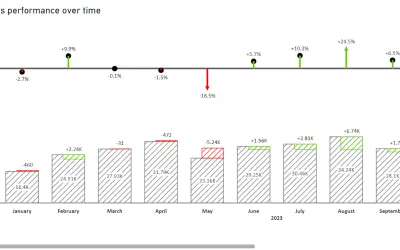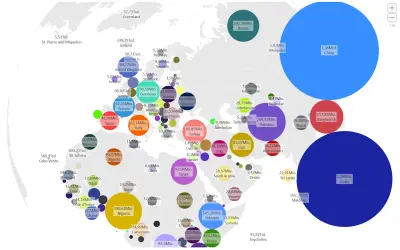
Cartogram
Cartogram transforms geographic or categorical data into geometric representations as a custom visual for Power BI.
relevantVisualsFreeCompare
7 apps
Cartogram transforms geographic or categorical data into geometric representations as a custom visual for Power BI.
relevantVisuals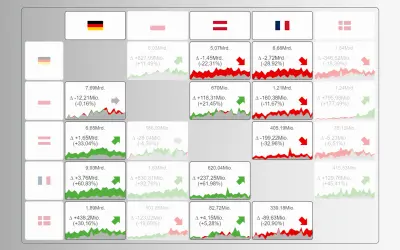
KPI Matrix is a visual that combines KPI cards with a matrix layout to display measures across two dimensions in Power BI.
relevantVisuals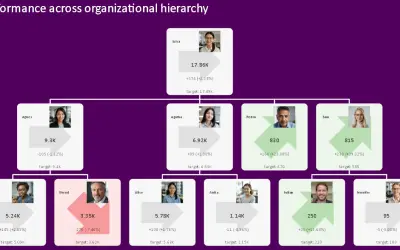
KPI Tree displays multiple KPI cards in an expandable hierarchy for Power BI reports with interactive filtering support.
relevantVisuals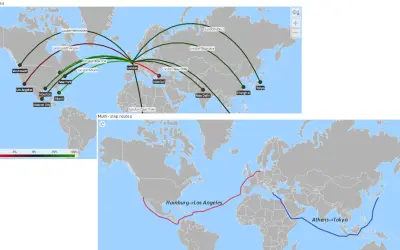
Builds choropleth, marker, route, and bubble maps with 200+ offline maps, custom shapes, and on-map mini-charts in Power BI.
relevantVisuals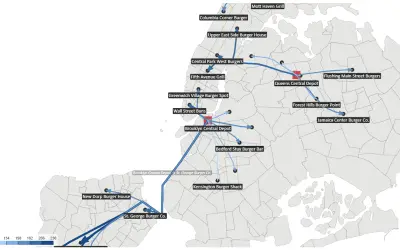
Custom-shape Power BI visual that renders user-supplied GeoJSON or TopoJSON maps with markers, routes, and mini-charts.
relevantVisuals