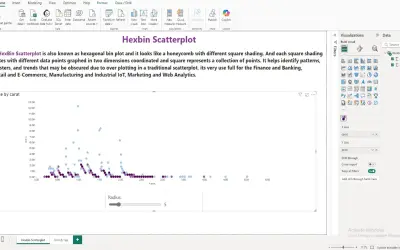
Hexbin Scatterplot by iFour
A Power BI visual that divides the data space into hexagonal bins to reduce overlap and visual clutter in large datasets.
iFour Technolab Pvt. Ltd.Paid
Transforms geographic or categorical data into geometric visuals in Power BI.
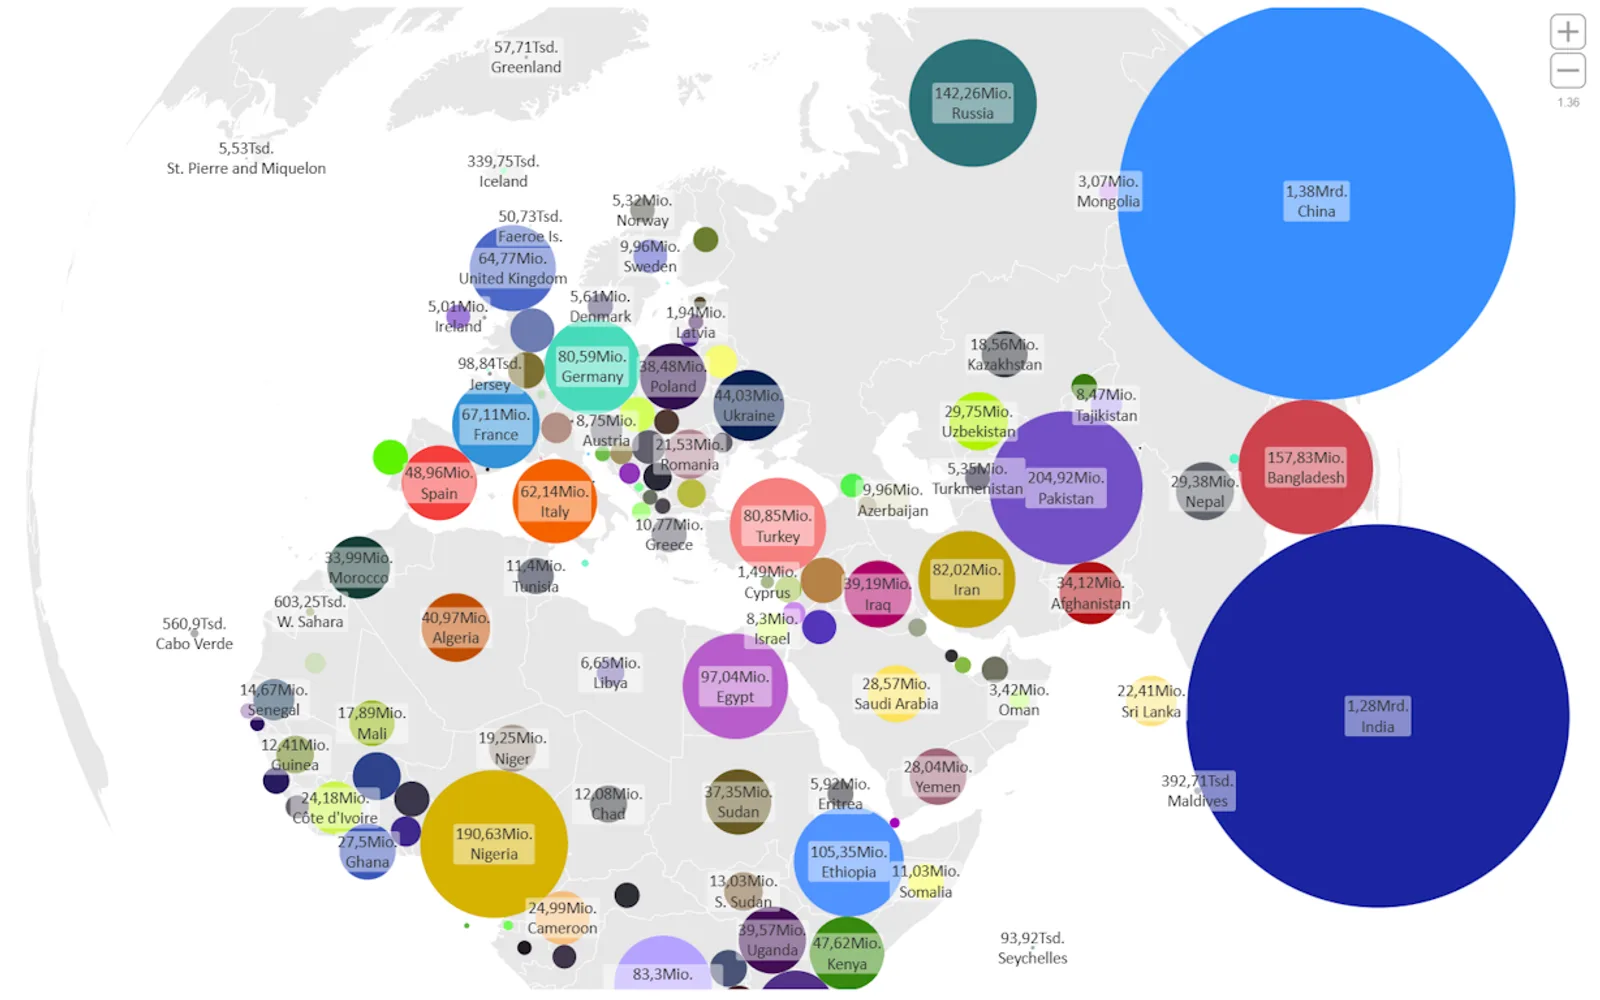
Transforms geographic or categorical data into geometric shapes such as circles, squares, rectangles, diamonds, and triangles in Power BI. Data points can become scalable, positionable objects with size, color, labels, and formatting driven by the dataset. The visual supports conditional styling, selection, highlighting, and tooltips.
Represents locations, regions, or custom shapes with circles, squares, rectangles, diamonds, triangles, and circular or rectangular images.
Uses dataset values to control object size, color, labels, and formatting.
Supports conditional styling for the visual elements.
Supports selection, highlighting, and tooltips.
Cartogram is free, while Hexbin Scatterplot by iFour is paid. Both listings use cloud deployment. Cartogram was updated on Mar 2026, while Hexbin Scatterplot by iFour was updated in 2025.
| Name | Pricing | Deployment | Updated |
|---|---|---|---|
| this plugin | Free | Cloud | |
| Hexbin Scatterplot by iFour | Paid | Cloud |
657 plugins in Power BI · Analytics
Price distribution: 73 free, 108 freemium, 441 paid, 35 price not published
A Power BI visual that divides the data space into hexagonal bins to reduce overlap and visual clutter in large datasets.
iFour Technolab Pvt. Ltd.
Gantt Chart is a project management visual for Microsoft Power BI that tracks schedules, milestones, and resource workloads.
ChartPad
Creates visualizations from diverse chart types, combines multiple charts on one canvas, and adds custom annotations and tooltips.
Akvelon
Creates financial and business reports in Power BI with automatic variance calculations, P&L logic, and drill-down (s5, s6).
Zebra BI«Cartogram is a new custom visual for Power BI that transforms geographic or categorical data into clean, geometric representations—perfect for scenarios where spatial relationships matter less than clarity, comparability, and visual impact. Building on the foundation of the Maps visual, Cartogram lets you abstract …»