Ampler
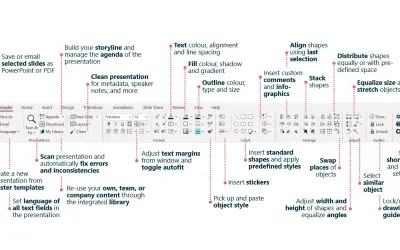
Ampler provides formatting, charting, document templating, and model-checking add-ins for PowerPoint, Word, and Excel.
AmplerPaidCompare
2531 analytics apps for Microsoft 365
Ampler provides formatting, charting, document templating, and model-checking add-ins for PowerPoint, Word, and Excel.
Ampler
Excel add-in that traces cell dependencies in financial models and ranks each input's impact on the output deterministically.
AnalystPro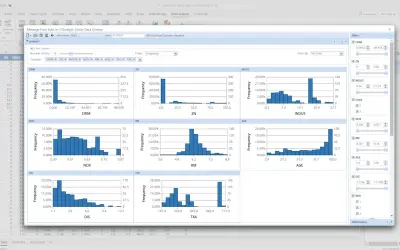
Analytic Solver Data Science trains forecasting, data mining, and text mining models in Microsoft Excel using statistical methods.
Frontline Systems Inc.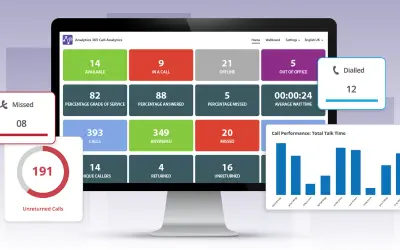
Free demo version that lets you explore Microsoft Teams call analytics metrics, reports and dashboards with sample data.
Tollring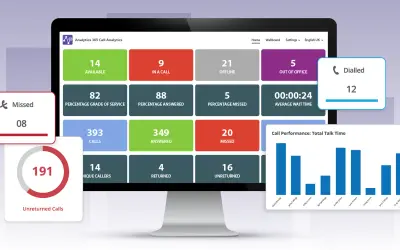
Provides call analytics for Microsoft Teams, giving companies insights into call activity, staffing levels, and performance.
Tollring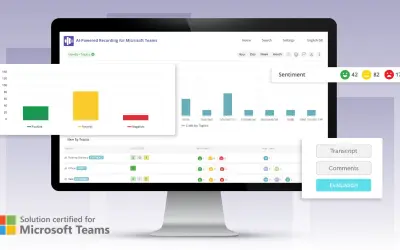
Records Microsoft Teams calls and analyzes them for compliance, training, dispute resolution, and performance trends.
Tollring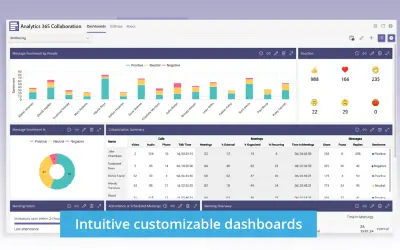
Provides dashboards and analysis of collaboration activity, capacity, sentiment and network quality for Microsoft Teams.
Tollring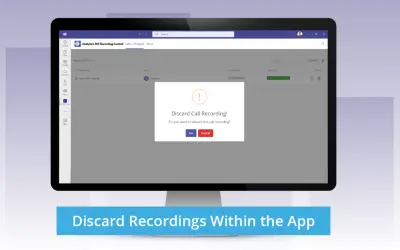
Free client that lets organisations with an active Analytics 365 Recording subscription pause, resume and discard recordings.
Tollring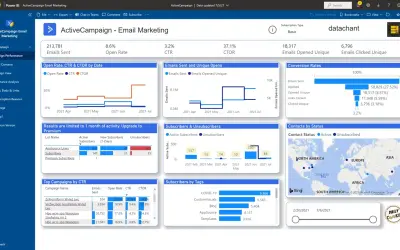
Power BI app providing interactive views of ActiveCampaign email marketing KPIs such as open rates, CTR, and CTOR.
DataChant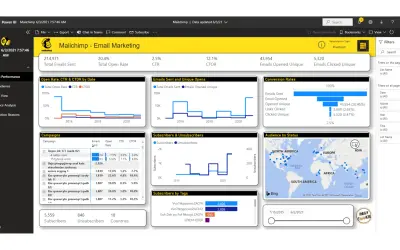
A Power BI app that connects to a Mailchimp account to analyze campaign performance, subscriber growth, and email KPIs.
DataChant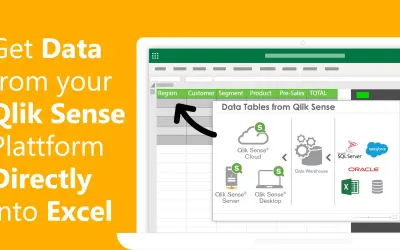
Excel add-in that loads, calculates and expands data from Qlik Sense apps directly in Excel, applying Qlik Sense filter logic.
akquinet finance & controlling GmbH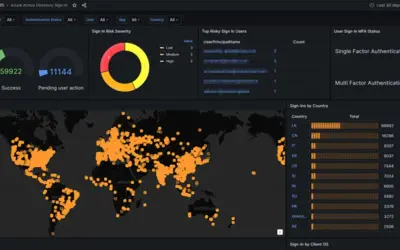
AnalytiQ360 provides security, compliance, license, and user analytics dashboards for Microsoft 365 environments.
ITX360 (Pvt) Ltd.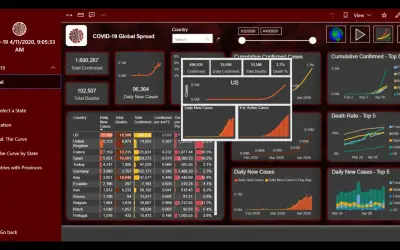
Power BI report for analyzing global and US COVID-19 pandemic and country-level vaccination data, refreshed daily.
DataChant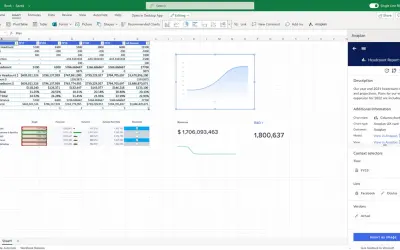
Anaplan for Microsoft 365 extends reporting and analytics to Word, Excel, and PowerPoint for existing Anaplan customers.
Anaplan Inc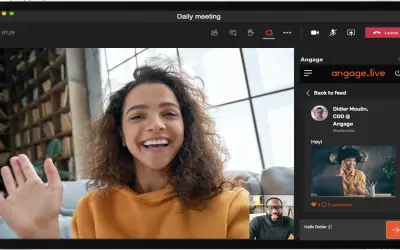
Angage Live provides real-time polling, Q&A, and brainstorming tools for virtual and on-site audiences within Microsoft Teams.
Angage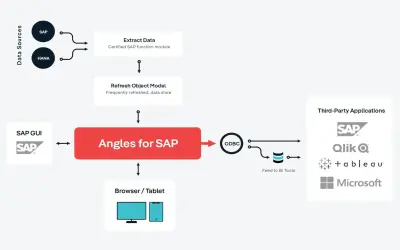
Delivers operational analytics and business intelligence for business users, using data from SAP ERP (ECC and S/4HANA).
insightsoftware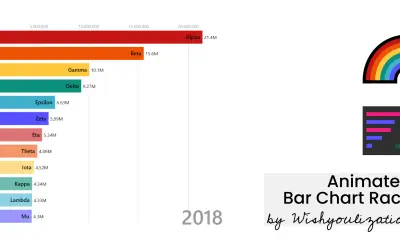
Animated bar chart race showing how trends change over time, with standalone autoplay or integration into reports with filters.
Wishyoulization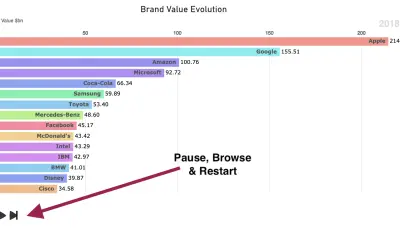
Animated Bar Race Chart animates bar positions and sizes across periods as a custom visual for Power BI via Inovista Animator.
INOVISTA LIMITED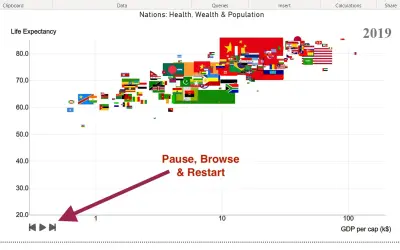
Animated Image and Bubble Chart animates bubbles or images across periods as a custom visual for Power BI via Inovista Animator.
INOVISTA LIMITED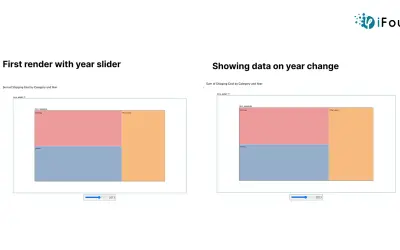
Animated Treemap by iFour tracks hierarchical data and explores time-based trends interactively within Power BI dashboards.
iFour Technolab Pvt. Ltd.
Shows employee birthdays by day, week, or month on a SharePoint intranet and enables one-click messages from the portal.
Redbelt-Security Sist Solucoes Seguranca Digital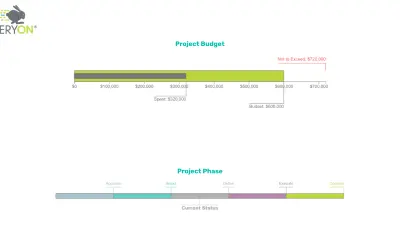
Bar chart that highlights key data, supports click drill-down, and offers stacked, clustered, or overlapping bar styles.
Queryon