
Power Plot Visual by Akvelon
Creates visualizations from diverse chart types, combines multiple charts on one canvas, and adds custom annotations and tooltips.
AkvelonFreemium
Transforms SAP ERP data for operational analytics and cross-process reporting.
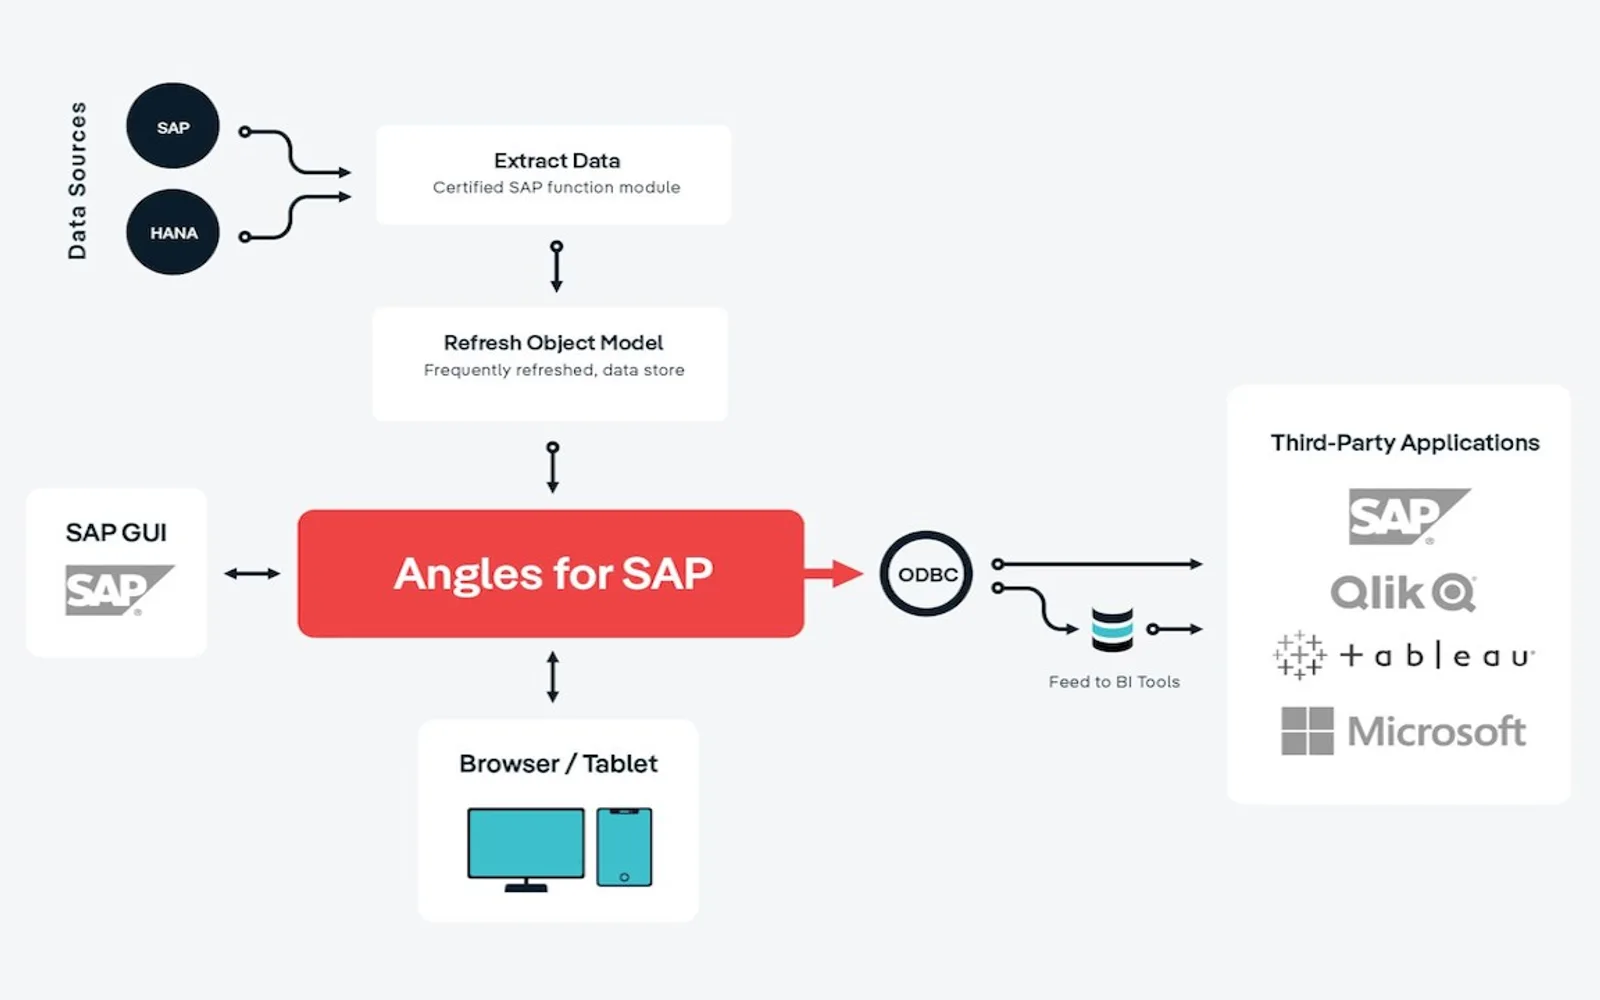
The add-in transforms data from SAP ERP tools, including ECC and S/4HANA, for operational analytics and business intelligence. It applies a context-aware, process-rich data model to SAP's complex data structure and presents information in business terms. Cross-process reporting combines data from multiple functions.
Transforms data from SAP ERP tools, including ECC and S/4HANA.
Provides operational analytics and business intelligence from SAP data.
Applies a context-aware, process-rich model to SAP's data structure.
Combines data from multiple functions for reporting.
Business users are the named audience.
2,531 plugins in Analytics
Price distribution: 125 free, 147 freemium, 1,350 paid, 909 price not published
Creates visualizations from diverse chart types, combines multiple charts on one canvas, and adds custom annotations and tooltips.
Akvelon
Creates financial and business reports in Power BI with automatic variance calculations, P&L logic, and drill-down (s5, s6).
Zebra BI
COSMO Text Module provides extended text management with a WYSIWYG editor for Microsoft Dynamics 365 Business Central.
COSMO CONSULT
Discover the why behind your data.
Data Courage«Magnitude Angles for SAP (formerly Every Angle) transforms and enhances your critical data from SAP ERP tools (including both ECC and S/4HANA), turning it into actionable insights. It puts the power of operational analytics and business intelligence into the hands of the people who need it most – the business users.»