
Gantt Chart
Gantt Chart is a project management visual for Microsoft Power BI that tracks schedules, milestones, and resource workloads.
ChartPadFree
Create labeled bar charts in Power BI with configurable label styling, bar formats, and drill-down interactions.
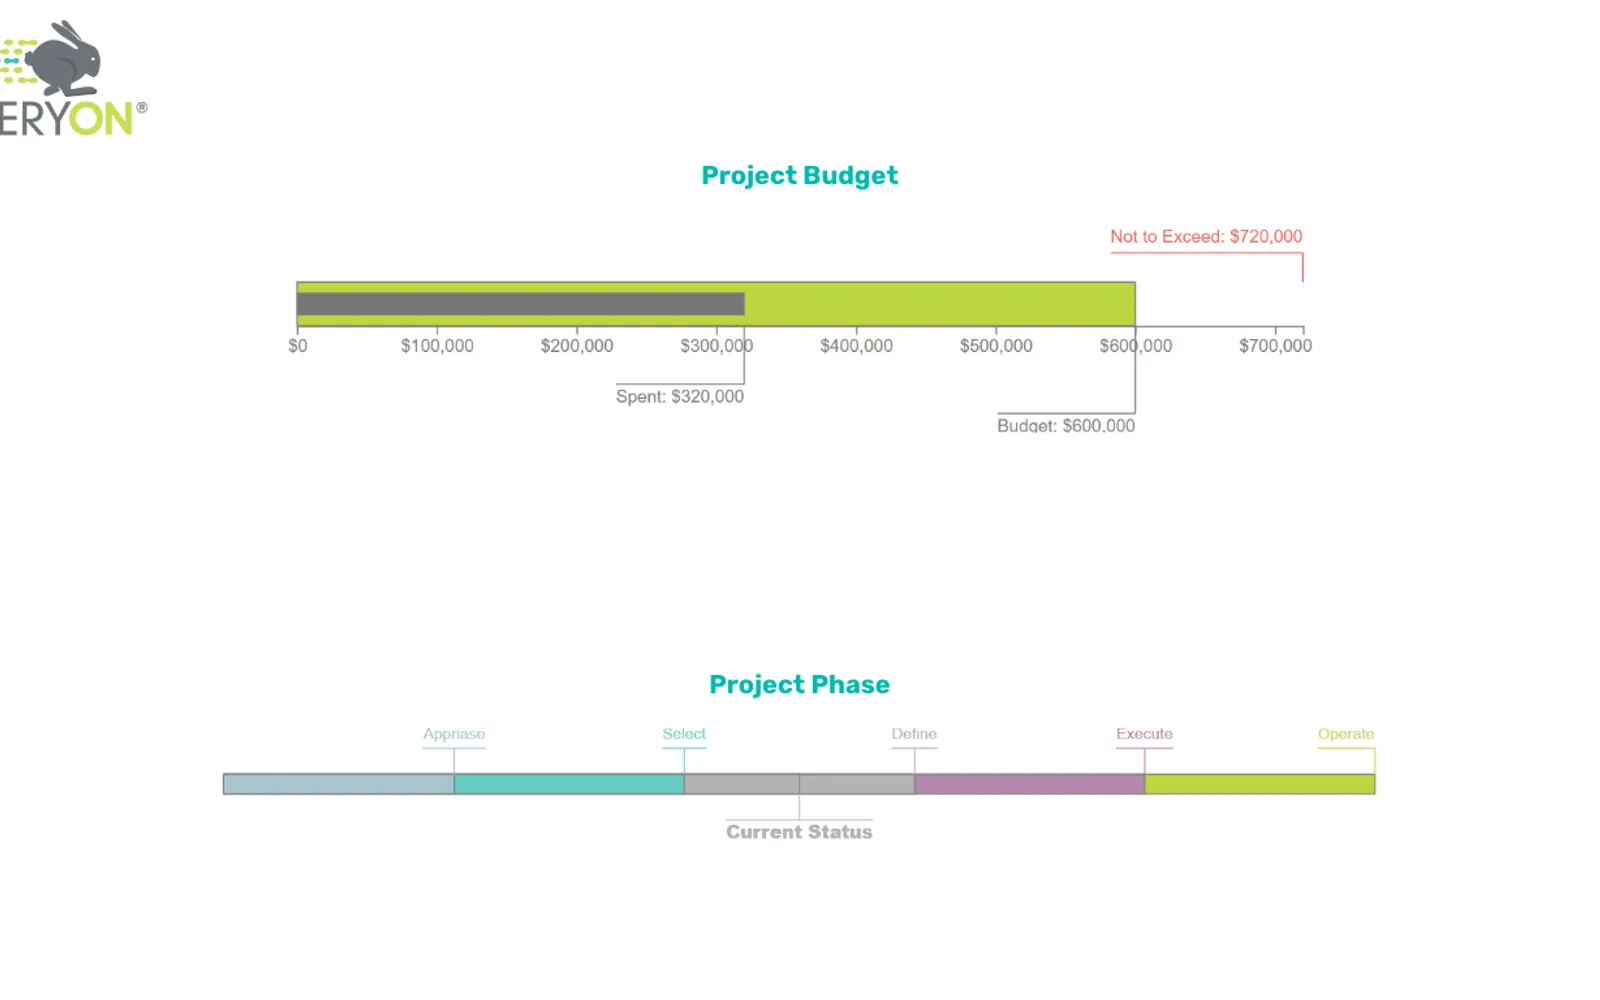
Annotated Bar adds labels to Power BI bar charts and allows label color, font, size, and position settings. Labels and bars can be clicked for drill-down interactions. Bar styles include stacked, side-by-side clustered, and overlapping bars. Overlapping bars can compare a project budget with its spend when one is part of the other.
Labels can be configured by color, font, size, and position at the top or bottom of bars.
The add-in supports stacked, side-by-side clustered, and overlapping bar styles.
Users can drill down by clicking a label or the bar itself.
Text labels can be hidden.
X-axis tick marks can be hidden.
The border of bars can be configured.
2,531 plugins in Power BI · Analytics
Price distribution: 125 free, 147 freemium, 1,350 paid, 909 price not published
Gantt Chart is a project management visual for Microsoft Power BI that tracks schedules, milestones, and resource workloads.
ChartPad
Creates visualizations from diverse chart types, combines multiple charts on one canvas, and adds custom annotations and tooltips.
Akvelon
Creates financial and business reports in Power BI with automatic variance calculations, P&L logic, and drill-down (s5, s6).
Zebra BI
AI analysis app for Dynamics 365 Business Central that provides customer KPIs, churn probability, and customer grouping.
Data Courage«Annotated Bar by Queryon combines bar chart functionality with customizable labels. Help your users pay attention to key data in a bar chart. Customize your labels color, font, size and position (top or bottom) of the bar. Users can drill down by clicking on labels or the bar itself. Bar styles include Stacked …»