
Power Plot Visual by Akvelon
Creates visualizations from diverse chart types, combines multiple charts on one canvas, and adds custom annotations and tooltips.
AkvelonFreemium
Animated bar chart visualizes changes in trends over time in reports.
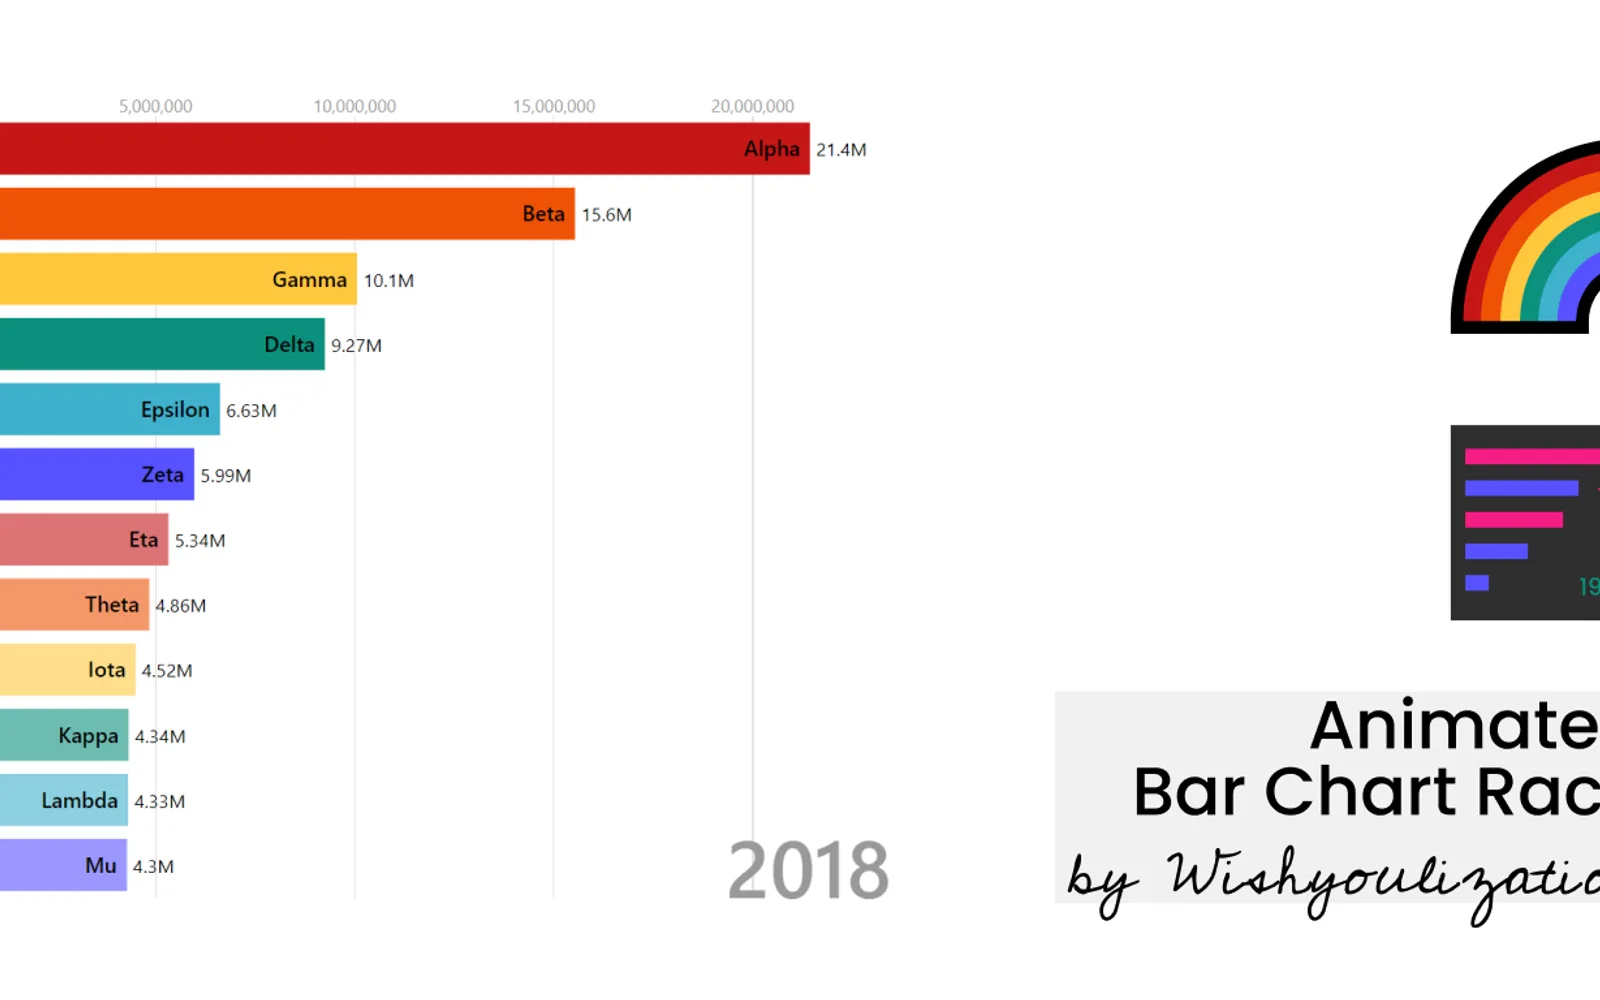
Displays changes in ranked data over time as an animated bar chart. It can run in standalone mode with autoplay or operate as a ranked bar chart within reports using other filters. Settings cover colors, graphical markings, labels, and animation controls.
Displays changes in trends over time through an animated bar chart.
Runs as a standalone chart with autoplay for the animation.
Works as a ranked bar chart within reports and can loop through filtered selections.
Provides controls for colors, graphical markings, labels, and animation behavior.
2,531 plugins in Analytics
Price distribution: 125 free, 147 freemium, 1,350 paid, 909 price not published
Creates visualizations from diverse chart types, combines multiple charts on one canvas, and adds custom annotations and tooltips.
Akvelon
Creates financial and business reports in Power BI with automatic variance calculations, P&L logic, and drill-down (s5, s6).
Zebra BI
COSMO Text Module provides extended text management with a WYSIWYG editor for Microsoft Dynamics 365 Business Central.
COSMO CONSULT
Discover the why behind your data.
Data Courage«The animated bar chart race helps you visualize the change in trends over time, these type of charts are very popular on social media as they provide a holistic data story/insight in a concise and easy to understand chart. This visual has two modes, a standalone mode with autoplay for animation or use as a ranked bar …»