
Gantt Chart
Gantt Chart is a project management visual for Microsoft Power BI that tracks schedules, milestones, and resource workloads.
ChartPadFree
Animates bubble charts in Power BI, with images that resize and move across periods.
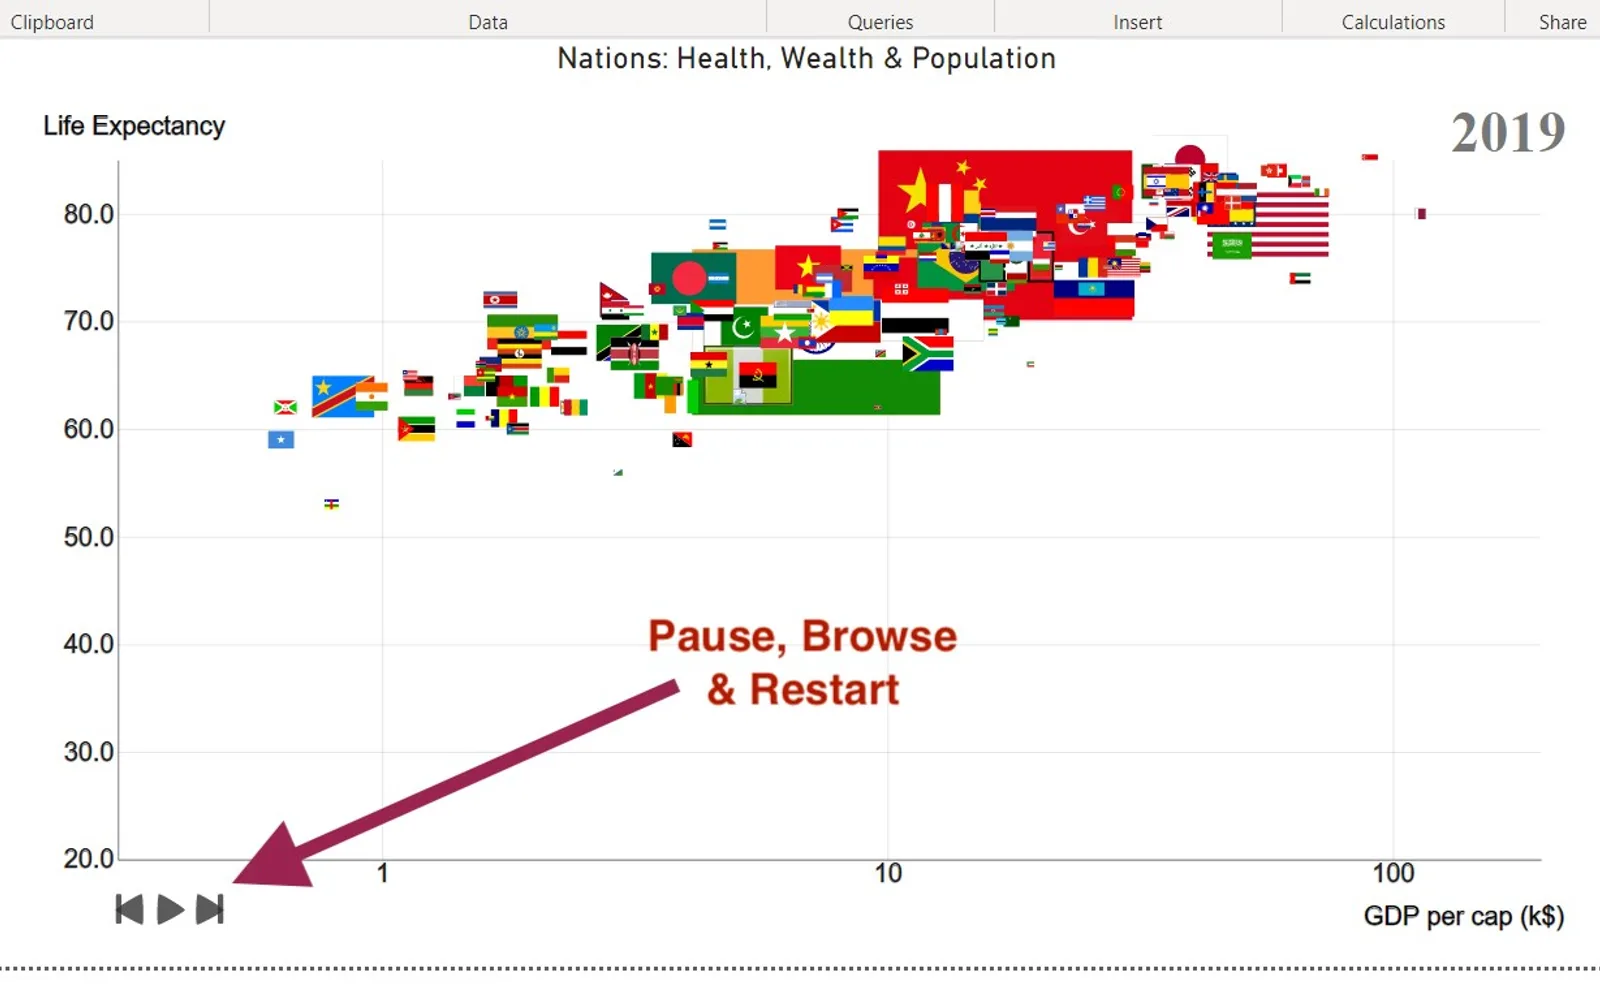
Presents a bubble chart that animates bubble size and position across periods such as time. Data points can use images from URL links or embedded Base64 text instead of bubbles. Animation can be paused, restarted, or navigated by period. Tooltips show axis guide lines and bubble or image values. Designer settings include linear or logarithmic axes, pause-panel visibility, font and color controls, and grouping options.
Bubbles resize and relocate as the chart moves through periods.
Images can replace bubbles and resize and relocate with the data.
Images can be provided through URL links or embedded Base64 text.
The animation can be paused, restarted, or browsed to the next or previous period.
Settings include linear or logarithmic axes, pause-panel visibility, font and color editing, and grouping options.
Animated Image and Bubble Chart is paid, while Bubble Chart with Categorical Data (Pro) is freemium. Both listings use cloud deployment. Animated Image and Bubble Chart was updated on Oct 2024, while Bubble Chart with Categorical Data (Pro) was updated on Dec 2025.
| Name | Pricing | Deployment | Updated |
|---|---|---|---|
| this plugin | Paid | Cloud | |
| Bubble Chart with Categorical Data (Pro) | Not in catalog | ||
657 plugins in Power BI · Analytics
Price distribution: 73 free, 108 freemium, 441 paid, 35 price not published
Gantt Chart is a project management visual for Microsoft Power BI that tracks schedules, milestones, and resource workloads.
ChartPad
Creates visualizations from diverse chart types, combines multiple charts on one canvas, and adds custom annotations and tooltips.
Akvelon
Creates financial and business reports in Power BI with automatic variance calculations, P&L logic, and drill-down (s5, s6).
Zebra BI
AI analysis app for Dynamics 365 Business Central that provides customer KPIs, churn probability, and customer grouping.
Data Courage«Highlights • The chart presents a typical bubble chart but offers the capability of animating the bubbles through periods such as time. The bubbles resize and relocate for each period. • Bubbles can be represented as images. For example, if the data represent countries, a flag image can be used in place of a bubble …»