
Power Plot Visual by Akvelon
Creates visualizations from diverse chart types, combines multiple charts on one canvas, and adds custom annotations and tooltips.
AkvelonFreemium
Generates organization charts from hierarchical relationship data.
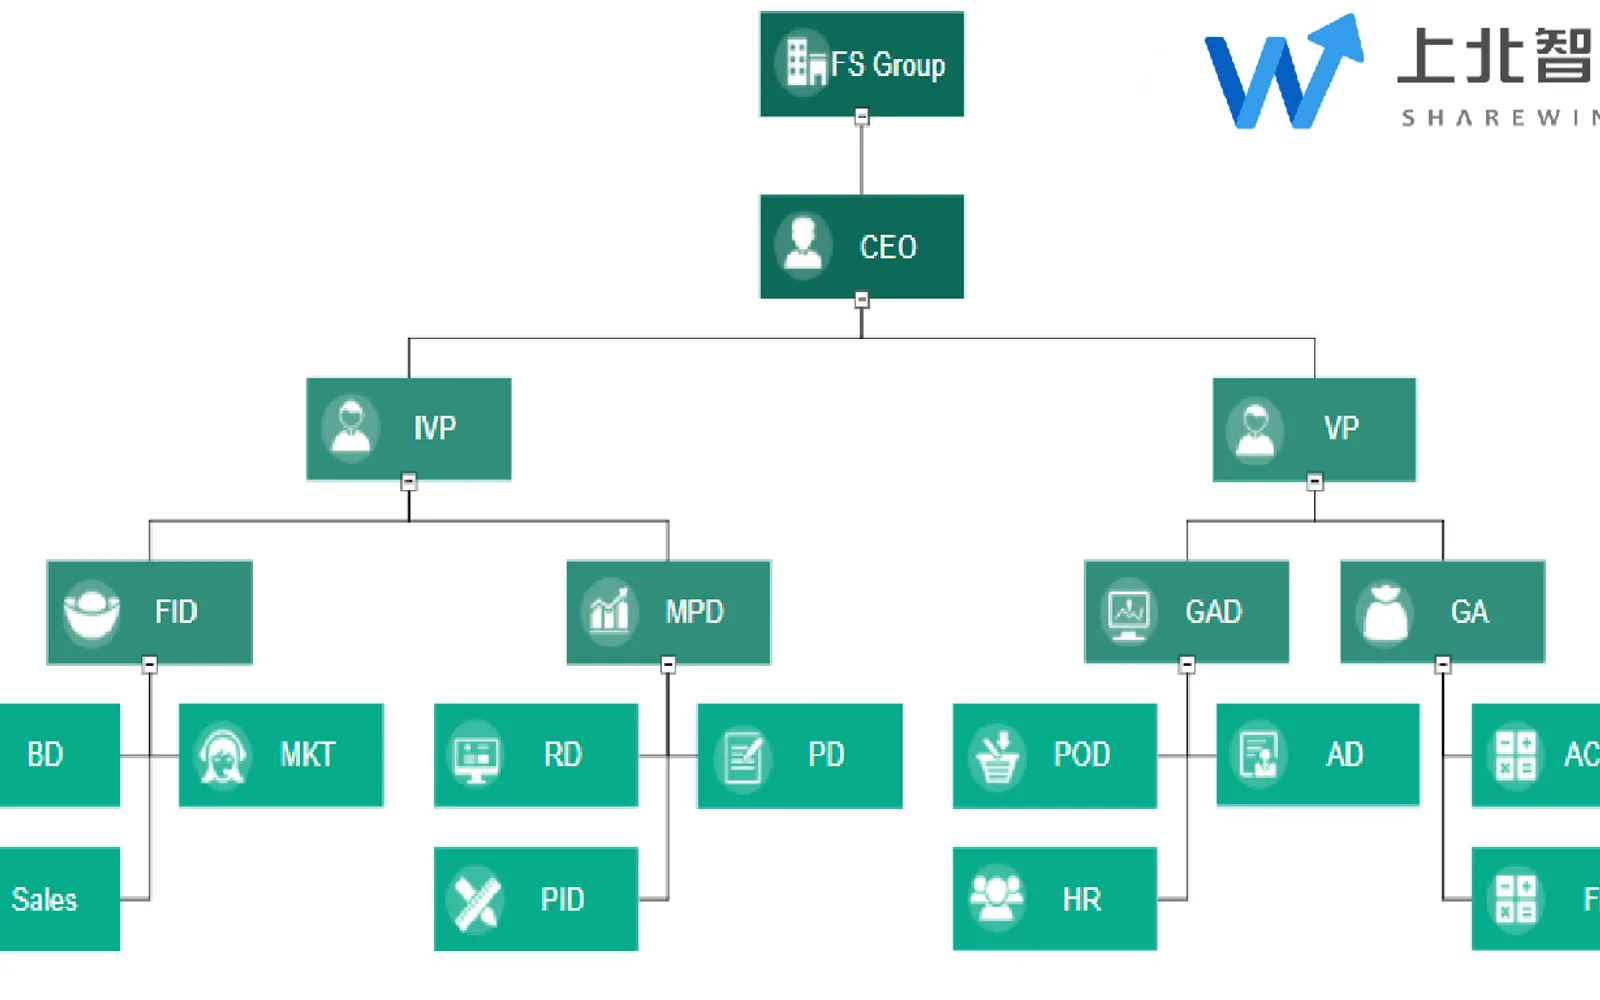
Generates organization charts that show roles, responsibilities, functions, authority levels, and reporting relationships. The chart layout is created from configured upper- and lower-level organizational relationships. Designers can set colors, fonts, backgrounds, images, and other styles. Readers can expand nodes to view the full chart or selected sections.
Creates organization charts from configured organizational relationships.
Generates an automatic chart layout from upper- and lower-level relationships.
Supports configuration of colors, fonts, backgrounds, images, and other styles.
Allows readers to expand nodes for global or partial chart views.
The listing names designers, readers, and employees.
2,531 plugins in Analytics
Price distribution: 125 free, 147 freemium, 1,350 paid, 909 price not published
Creates visualizations from diverse chart types, combines multiple charts on one canvas, and adds custom annotations and tooltips.
Akvelon
Creates financial and business reports in Power BI with automatic variance calculations, P&L logic, and drill-down (s5, s6).
Zebra BI
COSMO Text Module provides extended text management with a WYSIWYG editor for Microsoft Dynamics 365 Business Central.
COSMO CONSULT
Discover the why behind your data.
Data Courage«The organization chart of Sharewinfo is a standardized structure diagram generation control that can display the level and power, roles and responsibilities, functions, and relationships in the organization in a concise and clear manner. It helps employees understand and understand the company and clearly defines the …»