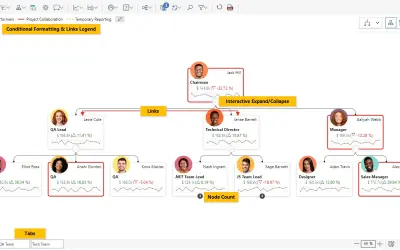
Performance Flow - xViz
Power BI visual for tracking supply chain, sales, and financial performance with interactive diagrams, alerts, and KPIs.
xViz LLC dba LumelFreemium
Displays hierarchical employee data as an interactive organization chart in Power BI.
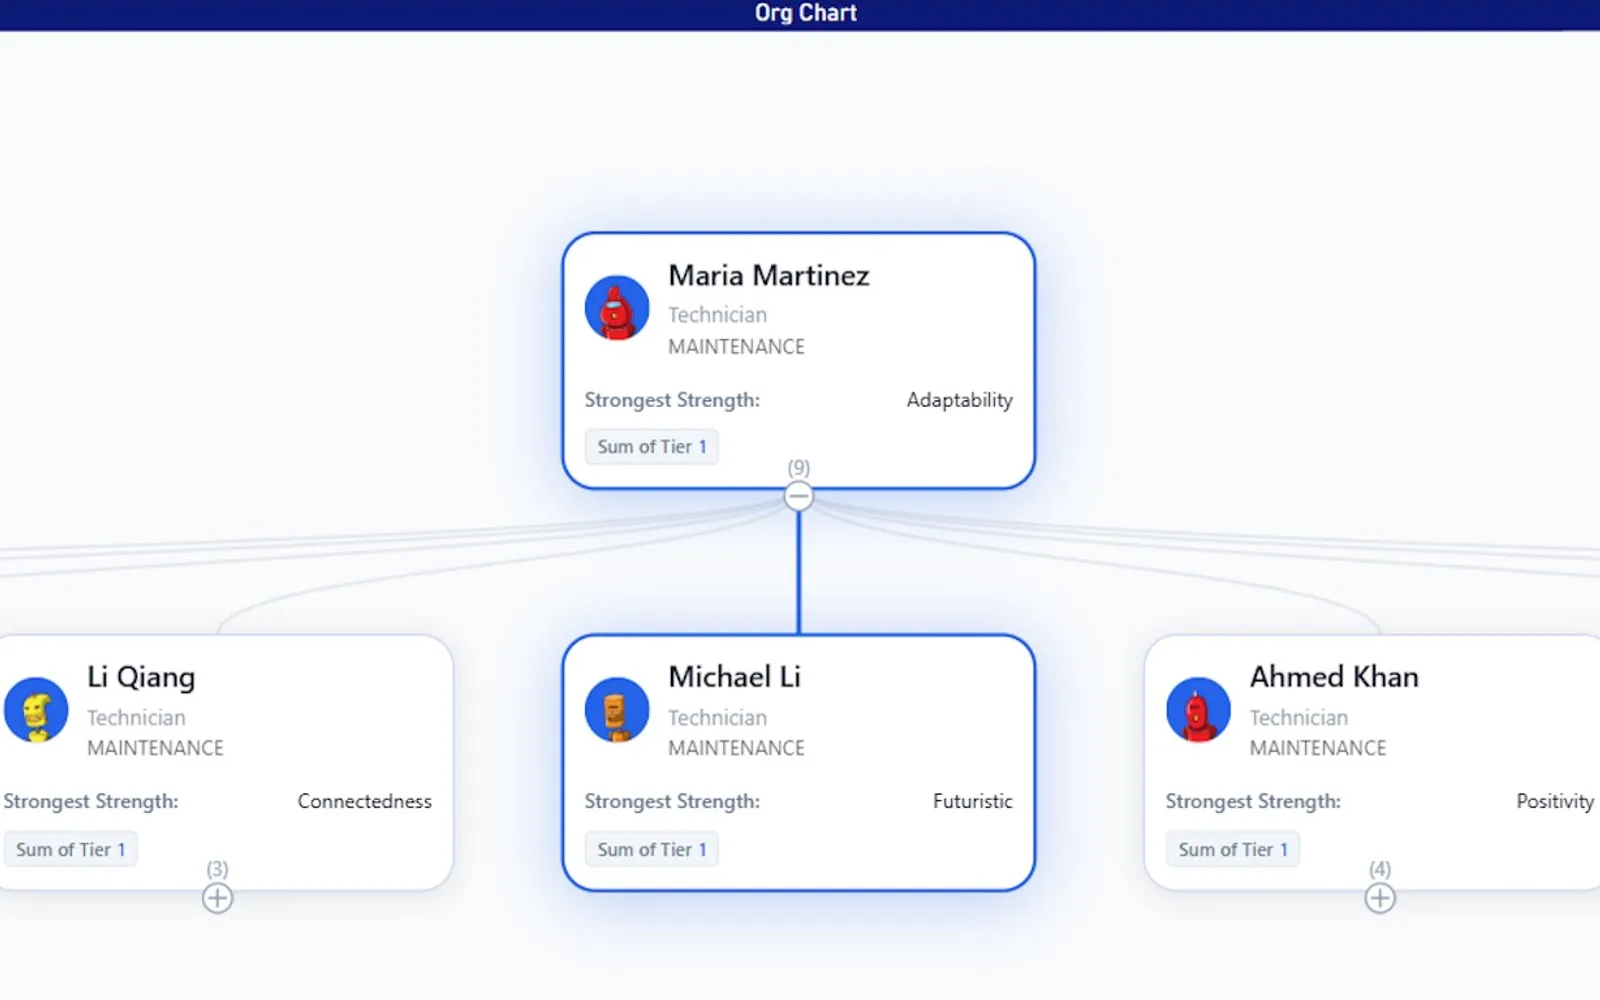
This Power BI visual turns hierarchical personnel data into an organization chart. The chart supports movement, zooming, branch toggling, and employee lookup by name or ID. Employee panels can include roles, divisions, photos, extra details, and metric badges. Layout direction, visual styling, and hover details can be configured.
Users can zoom and pan across the organization chart and open or hide branches.
The search function locates an employee by name or ID and moves the view to that person.
Panels can show a person's name, title, division, profile image, extra fields, and metric badges.
Configuration options include panel appearance, typography, dimensions, borders, connectors, and vertical or horizontal orientation.
Additional employee fields appear in a tooltip when the pointer rests over an employee.
This visual is for HR professionals, managers, business analysts, data professionals, executives, team leaders, and Power BI users handling hierarchical personnel data.
Org Chart That Works is paid and cloud-deployed. Performance Flow - xViz and Sunburst Chart are freemium with cloud deployment, while Sift has an unknown pricing model and cloud deployment. Organimi and Progress Icon are paid and cloud-deployed. Org Chart That Works was updated on Sep 2025; the alternatives list update dates from May 2025 to Jul 2026.
| Name | Pricing | Deployment | Updated |
|---|---|---|---|
| this plugin | Paid | Cloud | |
| Performance Flow - xViz | Freemium | Cloud | |
| Sunburst Chart | Freemium | Cloud | |
| Sift | Price not published | Cloud | |
| Organimi | Paid | Cloud | |
| Progress Icon | Paid | Cloud |
1,365 plugins in Power BI · Analytics
Price distribution: 89 free, 137 freemium, 651 paid, 488 price not published
Power BI visual for tracking supply chain, sales, and financial performance with interactive diagrams, alerts, and KPIs.
xViz LLC dba Lumel
Sift provides an interactive org chart, employee profiles, and instant people search within Microsoft Teams and Outlook.
Sift, LLC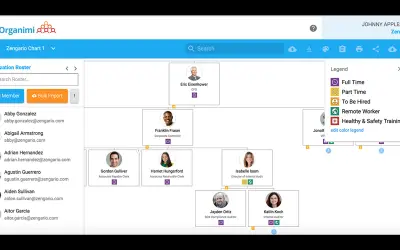
Organimi is purpose-built org chart software for creating, sharing, and printing organizational charts for your workplace.
Organimi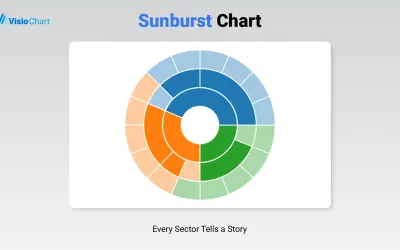
Displays up to five levels of hierarchical data as proportional segments across concentric rings in Power BI reports.
VisioChart«1. Description of the offer This custom visual for Power BI transforms your hierarchical data into a beautiful and feature-rich organization chart. It allows you to visualize reporting structures, team compositions, and employee details in an intuitive and interactive format. Key features include: Interactive …»