
Power Plot Visual by Akvelon
Creates visualizations from diverse chart types, combines multiple charts on one canvas, and adds custom annotations and tooltips.
AkvelonFreemium
Analyzes Ministry of Education open data for school enrollment, retirements, available funds, and comparisons between schools.
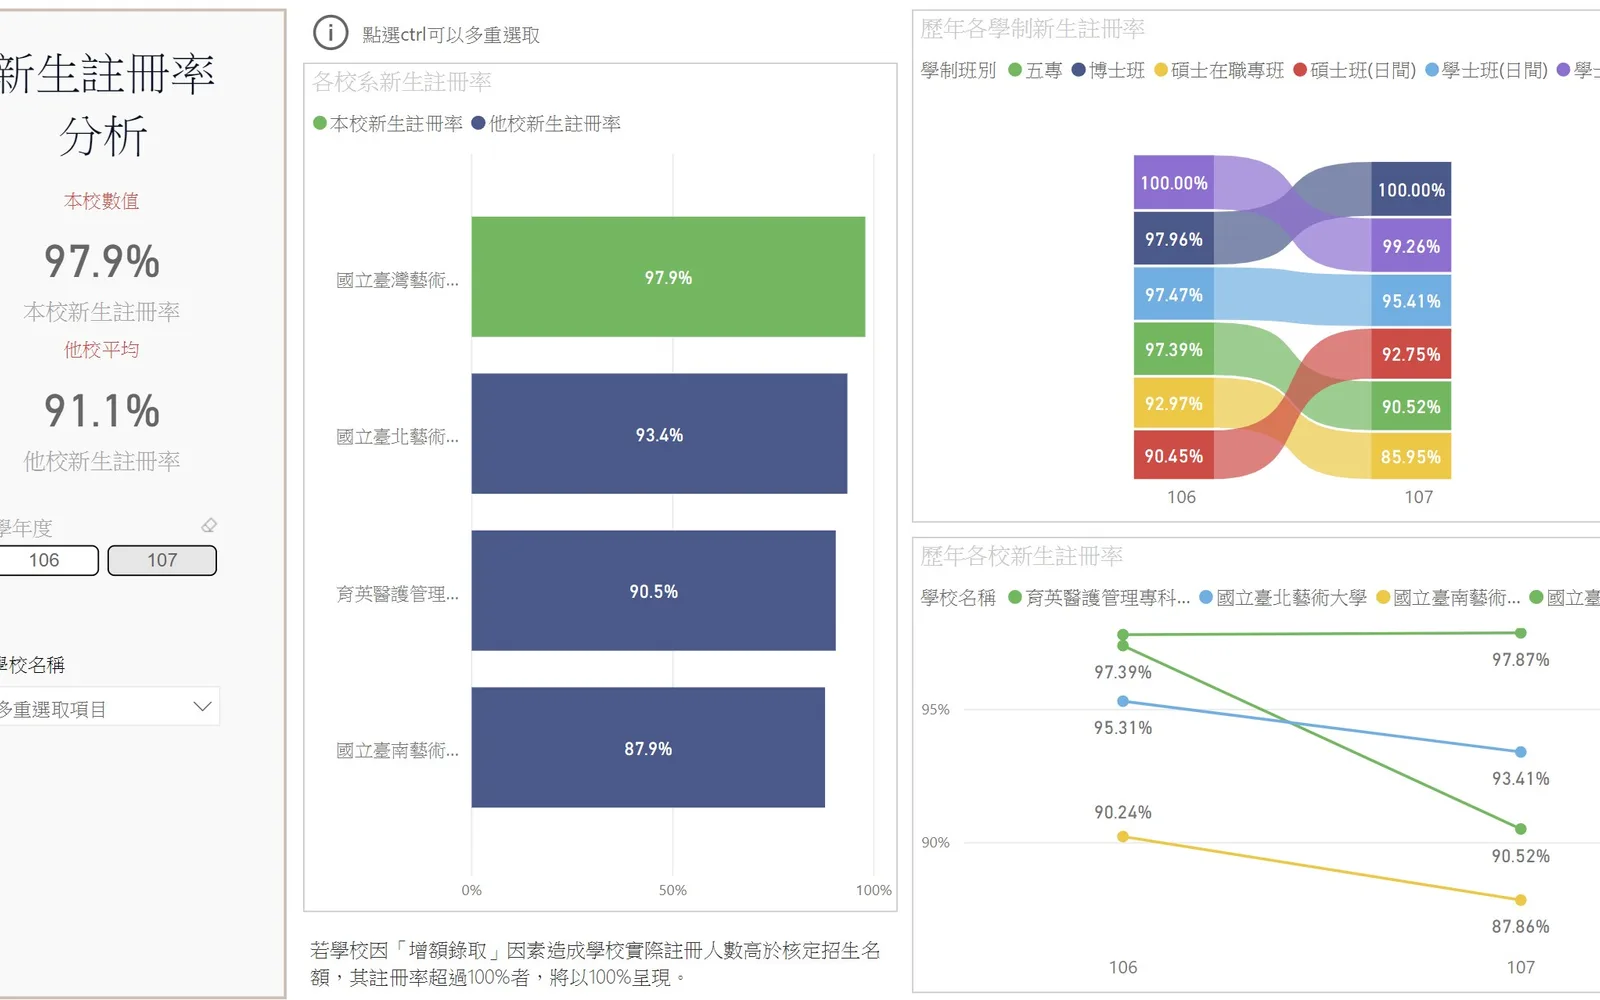
Analyzes Ministry of Education open data on topics including enrollment, retirements, and available school funds. It presents data from different schools for comparison through an interface and visual charts. The application is available in Chinese.
Analyzes open data published by the Ministry of Education.
Compares data provided by different schools.
Uses charts to present school data for comparison.
Schools.
2,531 plugins in Analytics
Price distribution: 125 free, 147 freemium, 1,350 paid, 909 price not published
Creates visualizations from diverse chart types, combines multiple charts on one canvas, and adds custom annotations and tooltips.
Akvelon
Creates financial and business reports in Power BI with automatic variance calculations, P&L logic, and drill-down (s5, s6).
Zebra BI
COSMO Text Module provides extended text management with a WYSIWYG editor for Microsoft Dynamics 365 Business Central.
COSMO CONSULT
Discover the why behind your data.
Data Courage«Analyze the open data of the Ministry of Education, cut through issues that schools would care about, such as enrollment, retirement, and available funds for schools. Use instinctive user interfaces and visual charts to compare data provided by each school. We develop this app for schools, in order to help them look …»