Financial Reporting Matrix by Profitbase
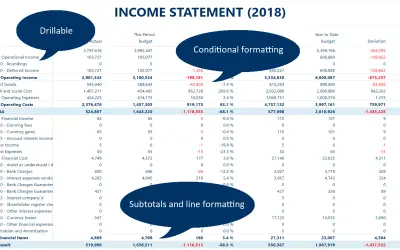
Custom Power BI matrix visual for financial reporting, with subtotals, custom measures, line formatting, and Excel export.
Profitbase ASFreemiumCompare
2531 analytics apps for Microsoft 365
Custom Power BI matrix visual for financial reporting, with subtotals, custom measures, line formatting, and Excel export.
Profitbase AS
Finess Data enables access to accounting data from multiple Xero organisations for reporting and analysis within Excel.
Finess Data
Finnex is a Microsoft Excel add-in for AI chat, document processing, database queries, and Xero-synced accounting automation.
Finnex AI
Provides analytics and reporting on Azure and Microsoft spending to help organizations track trends and align with budgets.
HABILELABS PRIVATE LIMITED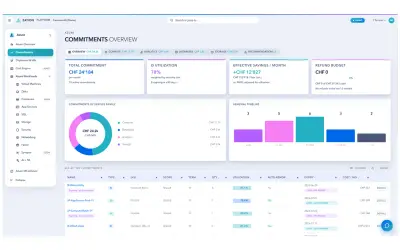
Zation FinOps Azure Foundation allocates costs, flags anomalies, and recommends rightsizing for Microsoft Azure environments.
Zation AG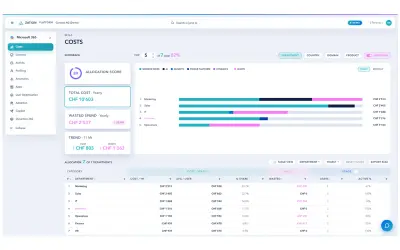
Provides daily visibility into Microsoft 365 license usage, inactive accounts, and spend leakage for enterprise organizations.
Zation AG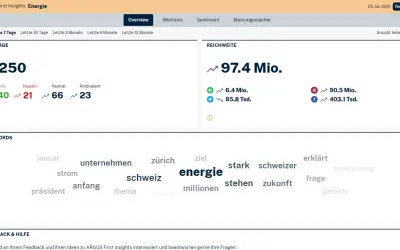
First Insights provides a dashboard with mentions, sentiments, reach, and top media for the ARGUS DATA INSIGHTS platform.
ARGUS DATA INSIGHTS
FirstHive is a customer data platform that runs cross-channel engagement campaigns and orchestrates customer journeys for brands.
FirstHive Tech Corp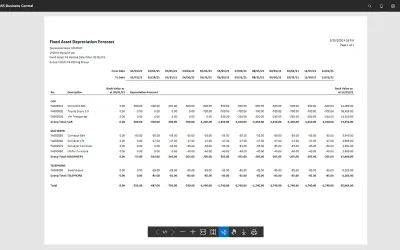
Produces fixed asset depreciation forecasts to speed up financial forecasting in Microsoft Dynamics 365 Business Central.
CHASE SOFTWARE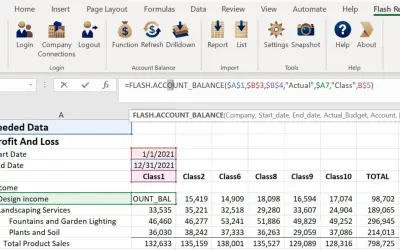
Automates QuickBooks Online financial reporting and models in Excel, saving users an average of 3-5 hours per month.
Finatical Software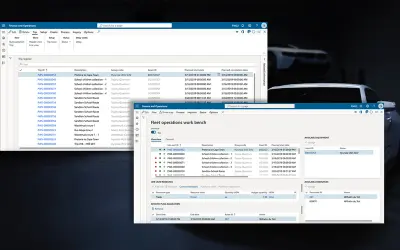
Fleet365 unifies fleet tracking, maintenance, driver, and fuel management on Dynamics 365 Finance & Operations.
SIS Global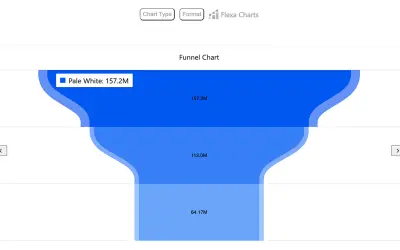
Flexa Charts hosts multiple chart types within a single visual for Power BI to compare metrics and track performance.
FlexaIntel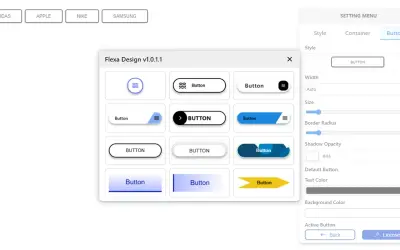
Flexa Design provides buttons, icons, and layout elements for styling Power BI reports and building professional dashboards.
FlexaIntel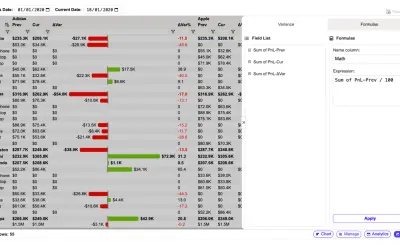
Adds pivoting, variance calculations, and header-based filtering to Power BI for end users of published reports.
FlexaIntel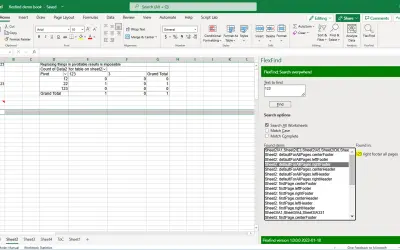
Excel add-in that searches for strings in workbook objects beyond worksheet cells, including formulas, chart titles, and shapes.
JKP Application Development Services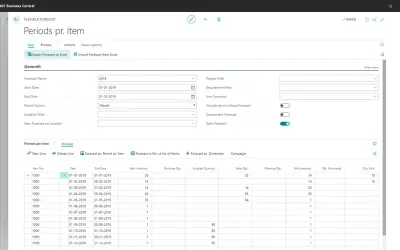
Shows a combined per-item view of inventory availability, orders, and forecasts for Microsoft Dynamics 365 Business Central.
Abakion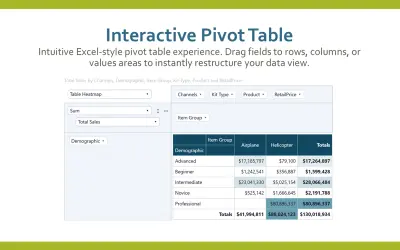
FlexiPivot adds an interactive drag-and-drop pivot table visual with multiple chart types to Microsoft Power BI reports.
PRECISION BI SOLUTIONS
FlexSite by Azosis deploys secure, customizable websites and portals on Azure for SMBs, education, and nonprofits.
AZOSIS TECHNOLOGIES PRIVATE LIMITED
Flipkart Ads Manager lets retailers run targeted ad campaigns with self-serve reporting and full-funnel attribution.
Flipkart India Pvt. Ltd.
SharePoint web parts that let enterprises track, monitor, and analyze their community interactions and initiatives.
366Pi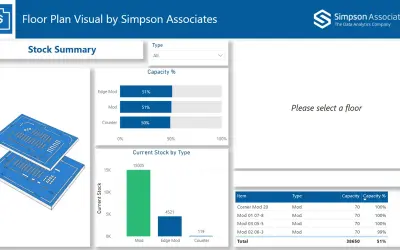
The Floor Plan Visual by Simpson Associates maps your metrics onto custom floor plans and other geometry data in your reports.
SIMPSON ASSOCIATES INFORMATION SERVICES LIMITED
Flow Finder for Excel maps formula relationships recursively — beyond Excel's Trace Precedents — and includes a reference report.
Excel Engineering Solutions Incorporated