
Sift
Sift provides an interactive org chart, employee profiles, and instant people search within Microsoft Teams and Outlook.
Sift, LLCPrice not published
Adds pivoting, variance calculations, header filtering, and what-if inputs to Power BI tables.
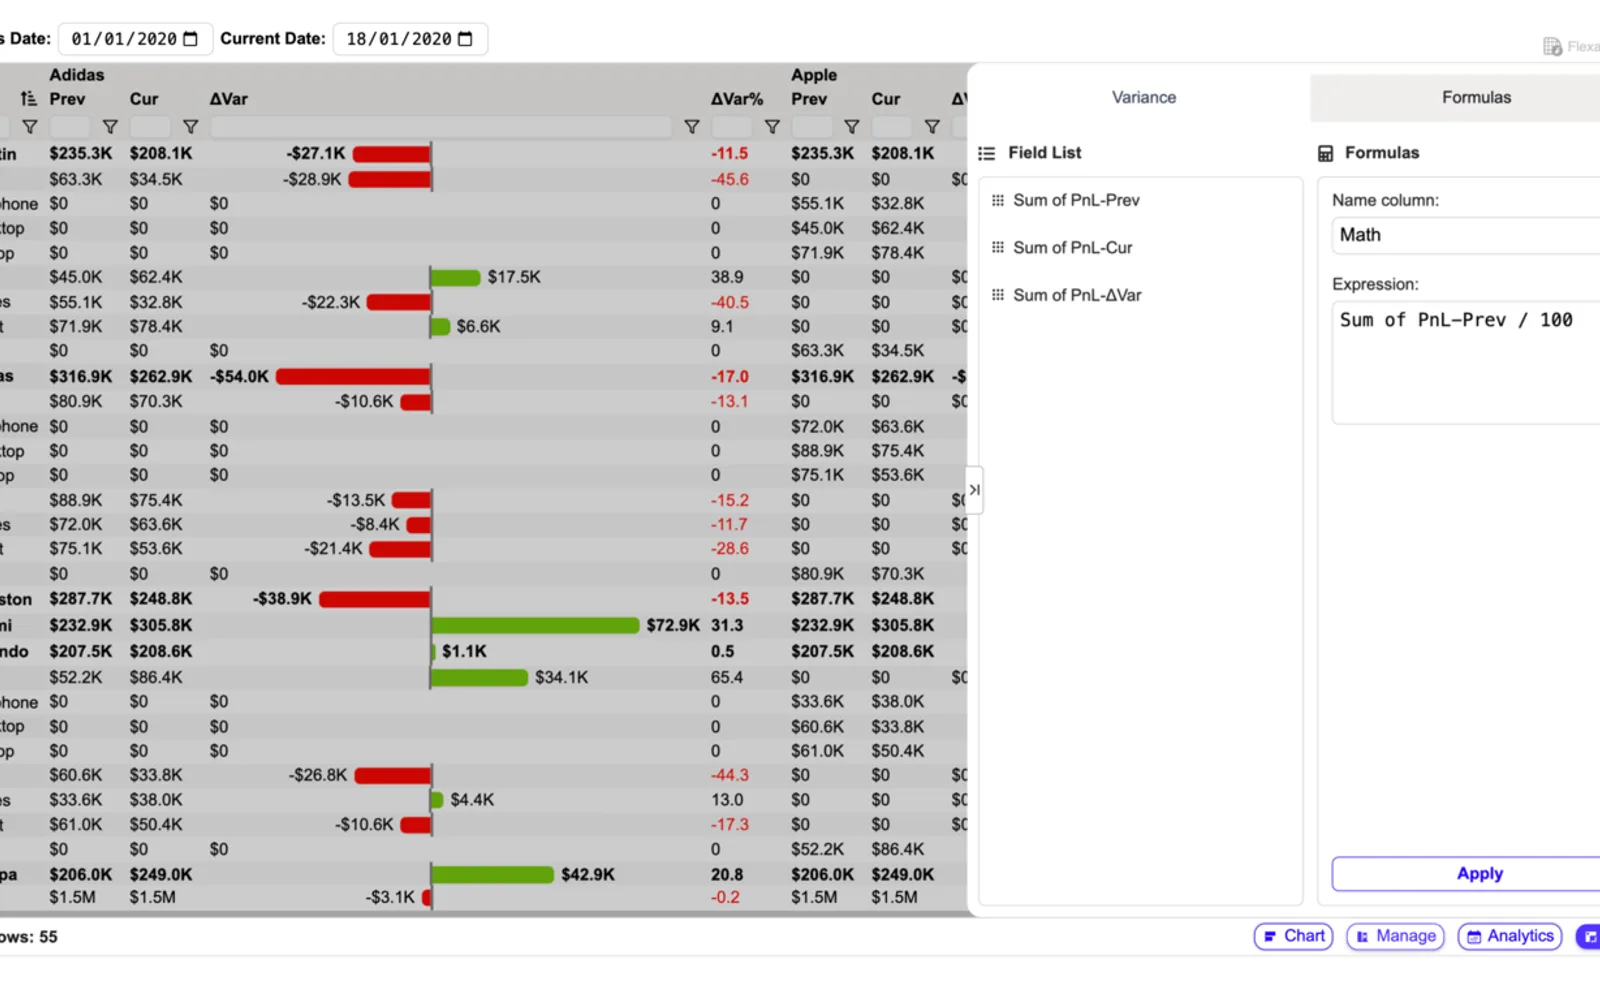
Flexa Tables is a visual add-on for Power BI that lets report users work with data in published reports. It includes pivot-table functions, variance calculations, access to source-data columns, live input changes, and filtering from table headers. Users can create custom views and run what-if scenarios within the report.
Calculates percentage, ratio, and value differences and displays them with charts.
Lets report viewers and developers pivot data and create custom views.
Provides access to columns from the original data source after publication.
Allows inputs and assumptions to be changed within the table for what-if scenarios.
Lets users filter data directly from table headers without slicers.
Business users, report viewers, developers, data consumers, and support teams.
Flexa Tables has a freemium pricing model and cloud deployment. Advanced Pie and Donut - xViz also has freemium pricing and cloud deployment, while Sift has cloud deployment and an unknown pricing model. Flexa Tables was updated on Aug 2026, compared with May 2025 for Sift and Dec 2025 for Advanced Pie and Donut - xViz.
| Name | Pricing | Deployment | Updated |
|---|---|---|---|
| this plugin | Freemium | Cloud | |
| Advanced Pie and Donut - xViz | Freemium | Cloud | |
| Sift | Price not published | Cloud |
1,622 plugins in Power BI · Analytics
Price distribution: 90 free, 139 freemium, 705 paid, 688 price not published
Sift provides an interactive org chart, employee profiles, and instant people search within Microsoft Teams and Outlook.
Sift, LLC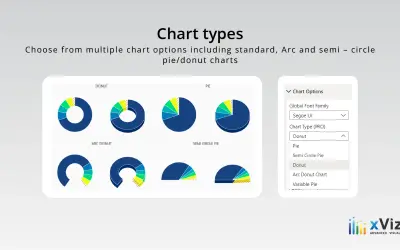
An xViz pie and donut chart for Power BI that compares parameters and displays each part's proportion of the whole.
xViz LLC dba Lumel
Gantt Chart is a project management visual for Microsoft Power BI that tracks schedules, milestones, and resource workloads.
ChartPad
Creates visualizations from diverse chart types, combines multiple charts on one canvas, and adds custom annotations and tooltips.
Akvelon«Fast, Secure, Living Data for Enterprise Decisions Flexa Tables is a Power BI visual add-on that greatly extends the capability of Power BI. It delivers enterprise-level savings by eliminating wasteful steps and unnecessary friction in the data analytics workflow. Flexa Tables puts data ownership into the hands of the …»