
Gantt Chart
Gantt Chart is a project management visual for Microsoft Power BI that tracks schedules, milestones, and resource workloads.
ChartPadFree
Adds buttons and layout controls to Power BI reports.
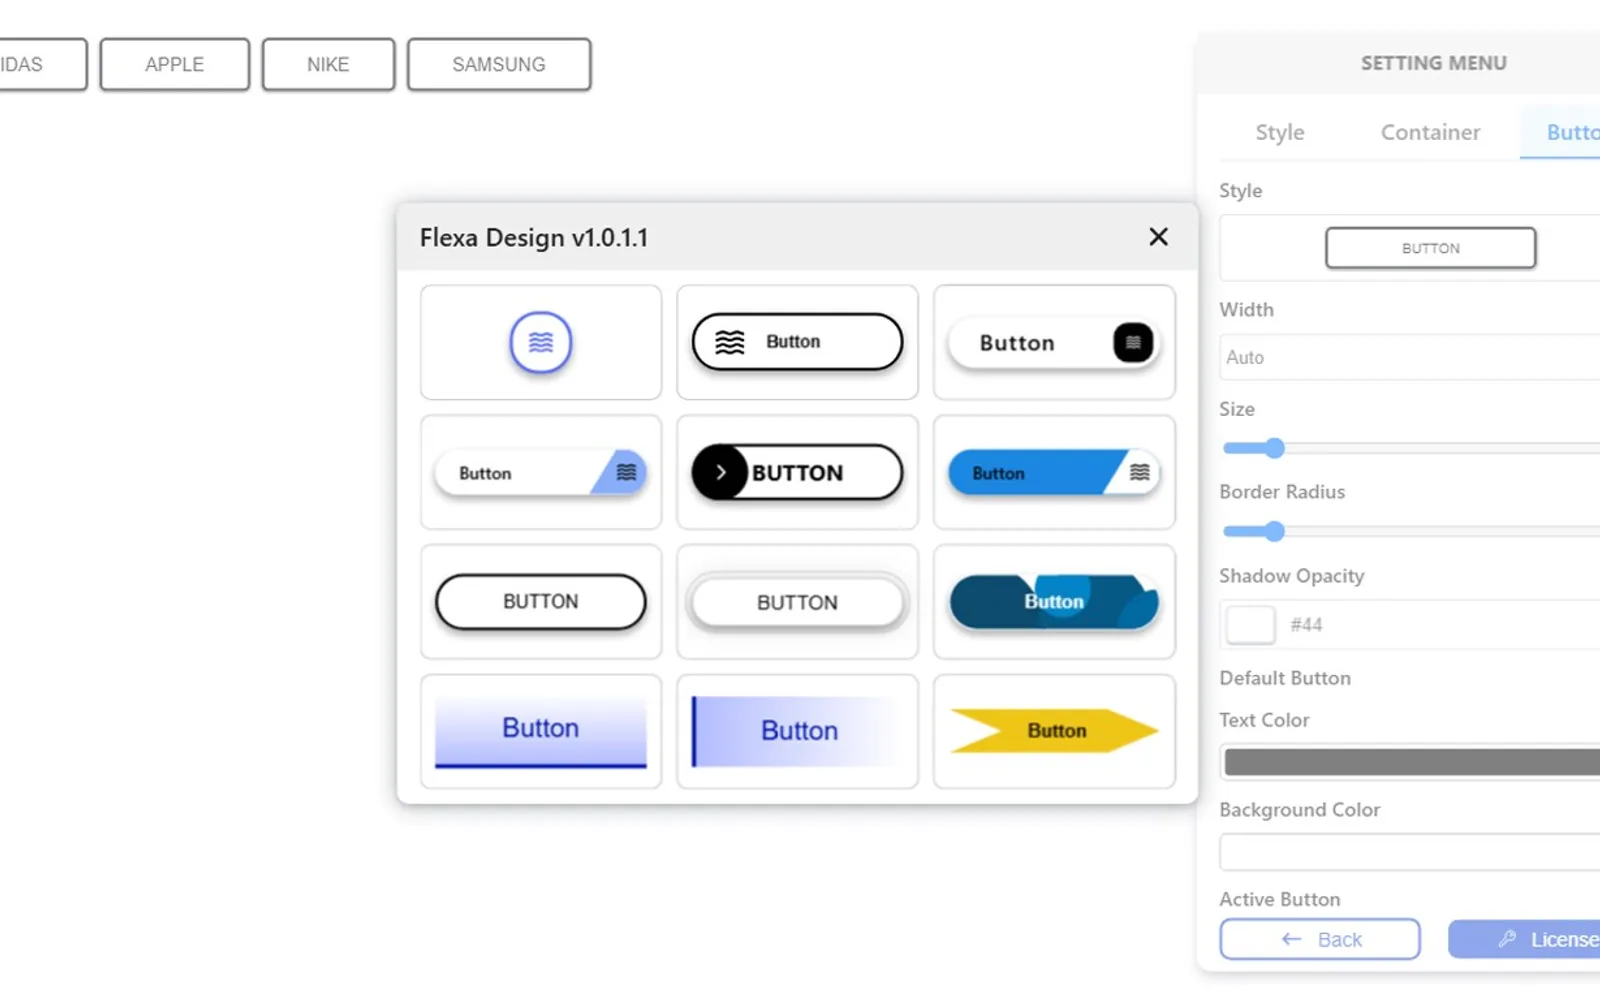
Provides toggle, standard, slicer, and interactive menu buttons with icon options for Power BI reports. It also offers sidebars, headers, and shape-based layout options for report design. The vendor states that the add-in supports report styling workflows for analysts and developers.
Provides toggle, standard, slicer, and interactive menu buttons with hundreds of icons.
Supports sidebar and header layouts using shapes.
Provides tools for styling Power BI reports.
Named users include analysts and developers.
657 plugins in Power BI · Analytics
Price distribution: 73 free, 108 freemium, 441 paid, 35 price not published
Gantt Chart is a project management visual for Microsoft Power BI that tracks schedules, milestones, and resource workloads.
ChartPad
Creates visualizations from diverse chart types, combines multiple charts on one canvas, and adds custom annotations and tooltips.
Akvelon
Creates financial and business reports in Power BI with automatic variance calculations, P&L logic, and drill-down (s5, s6).
Zebra BI
AI analysis app for Dynamics 365 Business Central that provides customer KPIs, churn probability, and customer grouping.
Data Courage«Flexa Design is a Power BI visual add-on that enables analysts and developers to craft stunning, user-friendly reports in seconds-no advanced design skills required. Key Features: • Dynamic Button Library: Choose from toggle buttons, standard buttons, slicer buttons, and interactive menu buttons, paired with hundreds …»