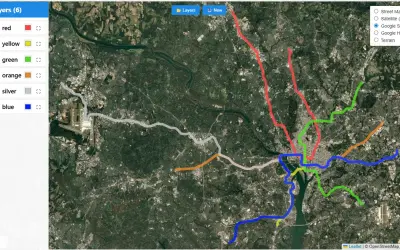
kml-kmz-visual
KML/KMZ Viewer renders points, lines, and polygons from KML and KMZ files on interactive maps within Power BI reports.
Abdalla DabesPaid
Visualizes origin-destination flows in Power BI with maps, curved lines, bubbles, and category-based colors.
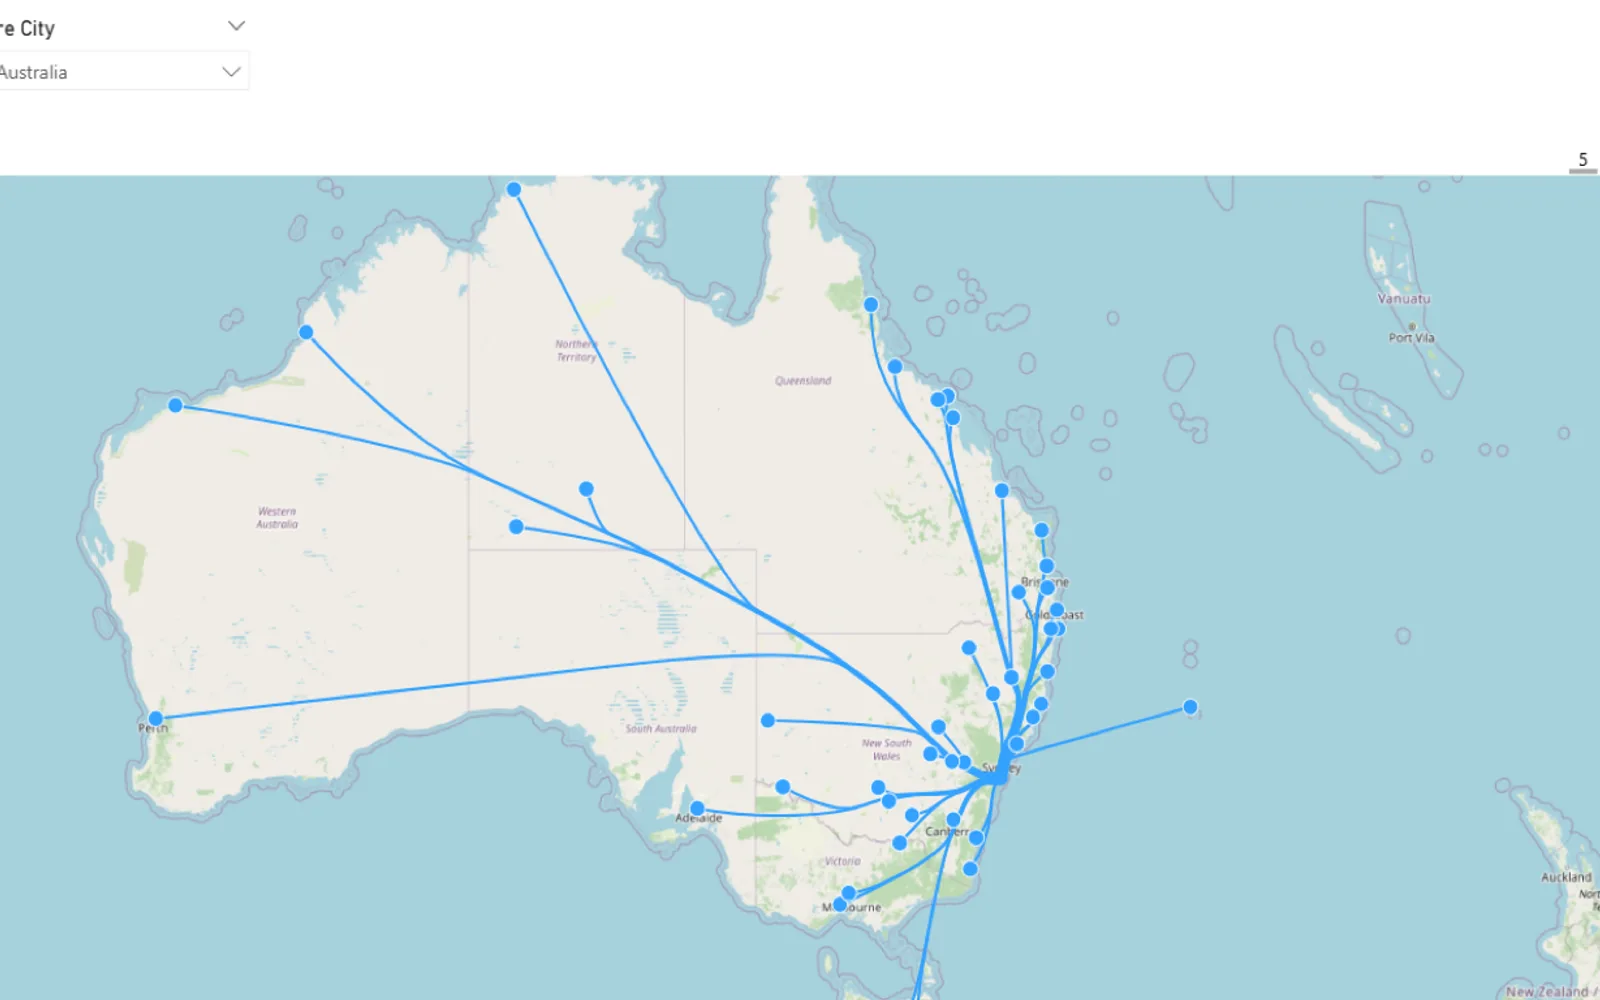
Connects Origin and Destination location names or coordinates in Power BI and renders flows between them on an interactive map. Flow values control line width, while categories can control flow colors. The visual can geocode plain-text location names and display bubbles, tooltips, legends, labels, and different map styles.
Displays straight, arc, or bundled lines between geographic points.
Converts plain-text location names into map locations without requiring coordinates.
Provides Road, Grayscale, Dark, Light, and hidden-background map styles.
Displays aggregated totals at origin and destination points.
Colors flows by category or applies one custom color.
Scales flow line width according to flow values.
Shows flow and bubble data on hover.
Generates legends for color-coded flows.
Flow Map for Power BI and kml-kmz-visual are both listed as paid cloud add-ins. Flow Map for Power BI is listed as paid and cloud, while Sunburst Chart is listed as freemium and cloud. The listing for Flow Map for Power BI is dated Jun 2026; the alternatives have update dates from Apr 2024 through May 2026.
| Name | Pricing | Deployment | Updated |
|---|---|---|---|
| this plugin | Paid | Cloud | |
| kml-kmz-visual | Paid | Cloud | |
| Sunburst Chart | Freemium | Cloud |
693 plugins in Power BI · Analytics
Price distribution: 73 free, 108 freemium, 471 paid, 41 price not published
KML/KMZ Viewer renders points, lines, and polygons from KML and KMZ files on interactive maps within Power BI reports.
Abdalla Dabes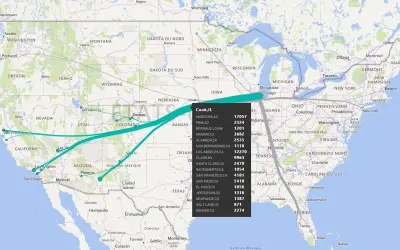
Flow map is a Power BI plugin that visualizes object movements by merging edges to reduce clutter and show directional trends.
Weiwei Cui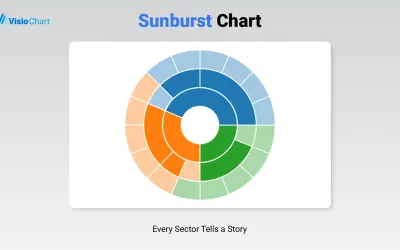
Displays up to five levels of hierarchical data as proportional segments across concentric rings in Power BI reports.
VisioChart
Power BI custom visual that fills an SVG icon to show KPI progress toward a target instead of a plain number on a card.
NeenOpal Inc«Flow Map for Power BI brings your movement data to life. Whether you're tracking trade routes, customer journeys, migration patterns, or logistics flows, Flow Map turns raw origin-destination data into stunning, interactive geographic visualizations — with no API keys, no subscriptions, and no limits. How it works …»