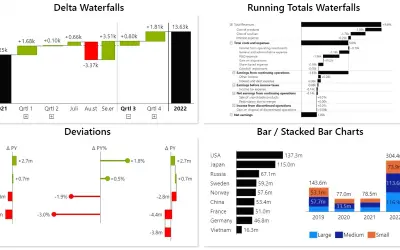
Innofalls Charts
Power BI visual for building waterfall and bar charts through interactive navigation, drill downs, and dynamic comparisons.
Innofalls GmbHFreemium
Create multiple chart types in one Power BI visual with configurable fields, titles, and display settings.
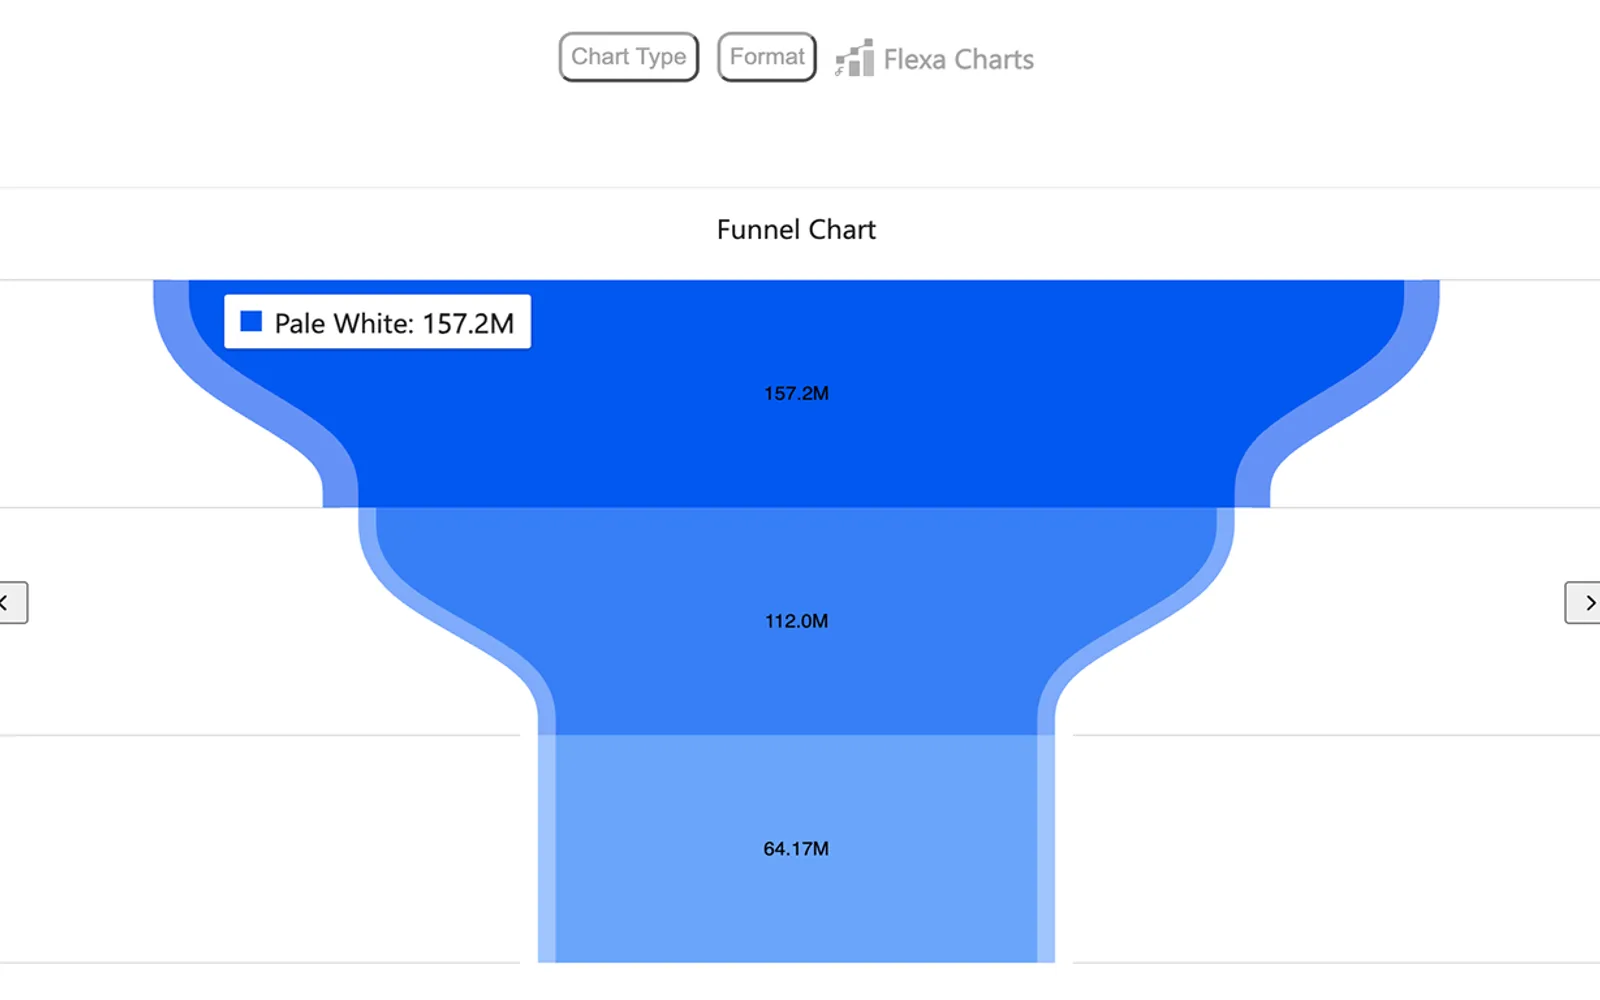
Flexa Charts is a visual for Power BI that can contain multiple charts in one visual. It includes chart types such as bar and line charts, along with other visualizations. Fields can be placed in values, axes, and legends, while chart titles and display settings can be customized.
The visual can contain multiple charts within one Power BI visual.
The visual includes bar charts, line charts, and other chart types.
Fields can be added to values, axes, and legends.
Chart titles and visualization settings can be adjusted.
Flexa Charts is named for analysts, business leaders, and report designers.
Flexa Charts is paid and cloud-deployed, while Innofalls Charts and hi-chart Reporting Studio are freemium and cloud-deployed. Flexa Charts was updated on Feb 2026, compared with Dec 2025 for Innofalls Charts, hi-chart Reporting Studio, and Waffle Chart Maker. Multi Line Chart with Tooltips and Xero Planning & Reporting by Acterys are also paid and cloud-deployed, with update dates of Jan 2025 and Apr 2025.
| Name | Pricing | Deployment | Updated |
|---|---|---|---|
| this plugin | Paid | Cloud | |
| Innofalls Charts | Freemium | Cloud | |
| hi-chart Reporting Studio | Freemium | Cloud | |
| Waffle Chart Maker | Free | Cloud | |
| Multi Line Chart with Tooltips | Paid | Cloud | |
| Xero Planning & Reporting by Acterys | Paid | Cloud |
657 plugins in Power BI · Analytics
Price distribution: 73 free, 108 freemium, 441 paid, 35 price not published
Power BI visual for building waterfall and bar charts through interactive navigation, drill downs, and dynamic comparisons.
Innofalls GmbH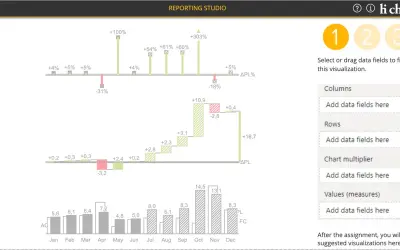
Creates charts, tables and waterfalls in Power BI with a built-in notation concept and automatic variance calculation.
CP Corporate Planning GmbH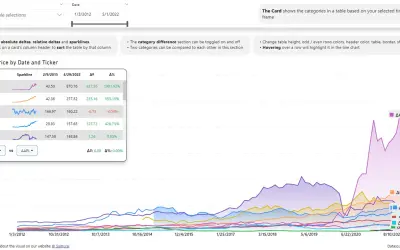
Power BI visual that compares categories over time, with YoY, MoM, YTD and MTD calculations, deltas and sparklines.
Datanauts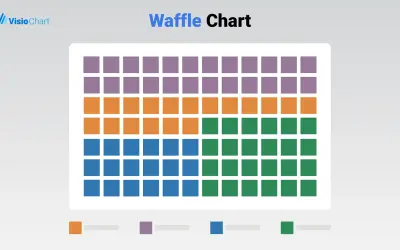
Waffle Chart Maker renders grid-based charts from numbers or percentages with sorting and cross-filtering for Microsoft Power BI.
VisioChart«Flexa Charts – Flexible and Powerful Data Visualization Flexa Charts is an advanced yet user-friendly visual for Power BI, designed to give you maximum flexibility in how you present and explore data. With a single visual, you can host multiple charts, making it easier to compare metrics, track performance, and tell a …»