Dot Plot
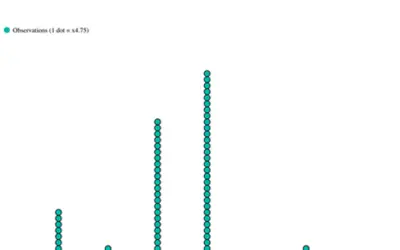
Dot Plot renders continuous, quantitative, univariate data as points on a simple scale for Microsoft Power BI.
Microsoft CorporationPaidCompare
2531 analytics apps for Microsoft 365
Dot Plot renders continuous, quantitative, univariate data as points on a simple scale for Microsoft Power BI.
Microsoft Corporation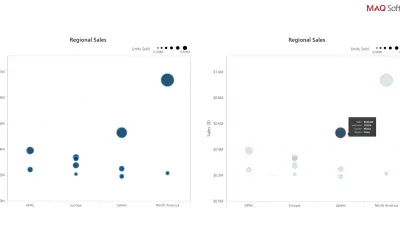
Dot Plot by MAQ Software displays categorized data points on an X/Y axis as a custom visual for Power BI.
MAQ LLC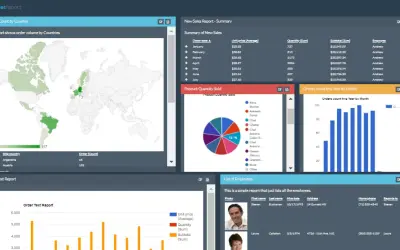
An SSRS alternative that embeds reporting and dashboards in web applications, with filters, drilldowns, charts, and a scheduler.
Dot Report, Inc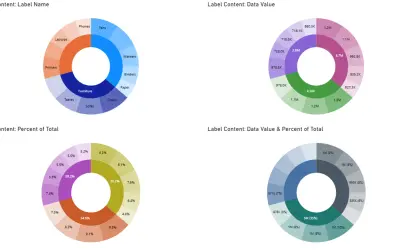
Power BI visual that shows primary categories and their subcategories as two concentric donut charts with interactive tooltips.
NeenOpal Inc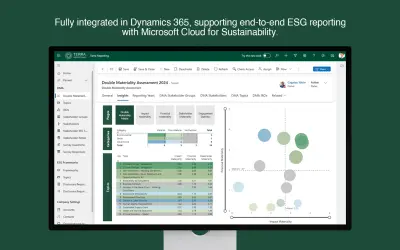
Terra Reporting's DMA module digitizes double materiality assessments for Microsoft Cloud for Sustainability.
Terra Reporting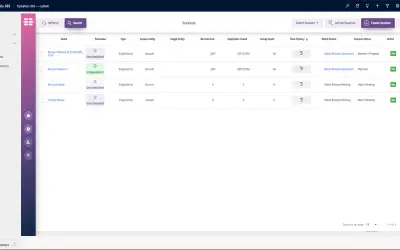
Identifies and merges duplicate records across Dynamics 365 entities, producing a single Golden Record through fuzzy search.
DQ Global
Draft Coach for Microsoft 365 gives students instant feedback on citations, grammar, and matches with Turnitin's database.
Turnitin LLC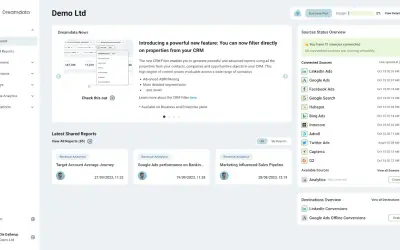
Combines Microsoft Dynamics CRM data with other customer data to map the B2B customer journey and attribute revenue.
Dreamdata
Search 130+ million Dreamstime files, insert selected images into PowerPoint slides, and preview the result before download.
Dreamstime.com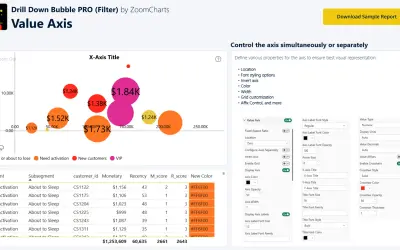
Drill Down Bubble PRO (Filter) provides interactive bubble charts with drill down and cross-chart filtering for Power BI.
ZoomCharts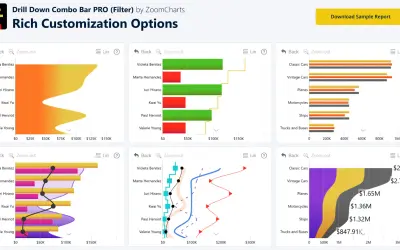
Sign up for a Free Developer License and get 1 year access to this and 20+ ZoomCharts visuals for use in Power BI Desktop!
ZoomCharts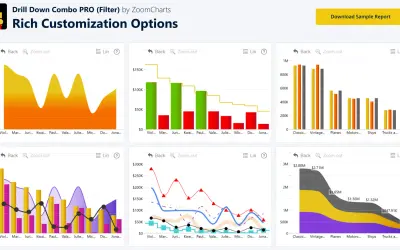
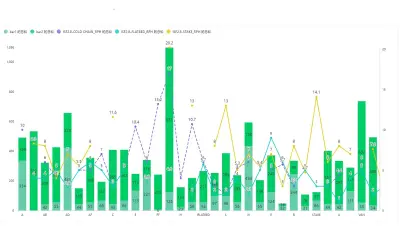
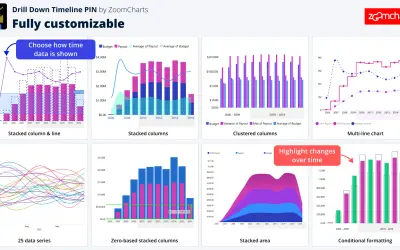
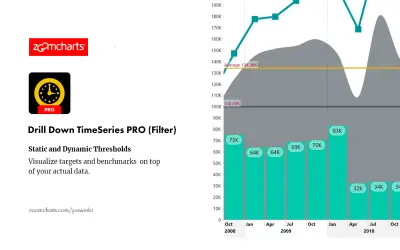
Drill Down Combo PRO (Filter) by ZoomCharts adds interactive drill-downs to column, line, and area charts in Power BI.
ZoomCharts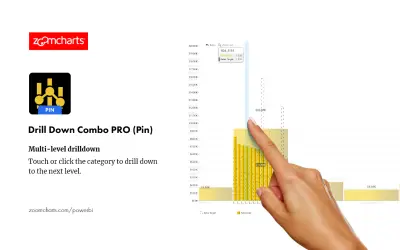
Adds column, line, and area chart types per series to Power BI dashboards, with stacking, clustering, and thresholds.
ZoomCharts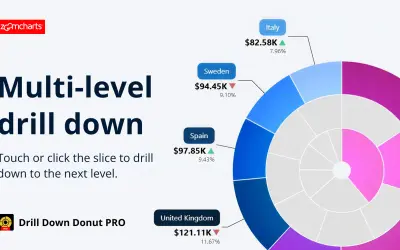
Drill Down Donut PRO is a KPI aware donut visual for Power BI, designed for performance reporting rather than simple category breakdowns.
ZoomCharts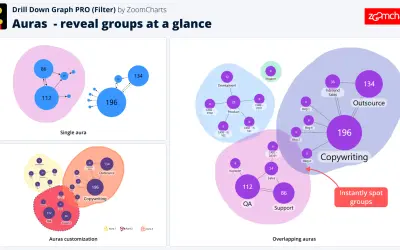
Drill Down Graph PRO (Filter) maps and explores graph data relations within Power BI using cross-chart filtering.
ZoomCharts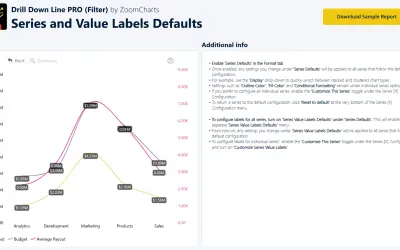
Drill Down Line PRO (Filter) provides interactive line charts with drill-down levels and cross-chart filtering for Power BI.
ZoomCharts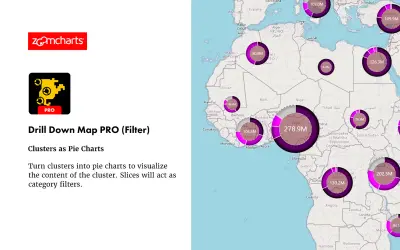
Drill Down Map PRO (Filter) by ZoomCharts visualizes and filters location data on interactive maps for Power BI Desktop reports.
ZoomCharts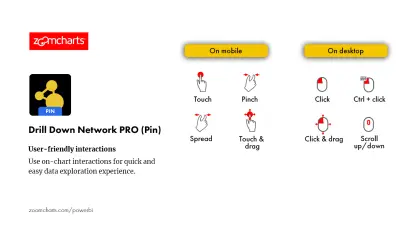
Drill Down Network PRO (Pin) by ZoomCharts renders interactive category-based network charts with drill-down support in Power BI.
ZoomCharts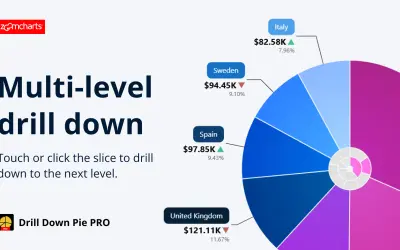
Power BI pie visual that combines drill down, per-category targets, and automatic others grouping in a single chart.
ZoomCharts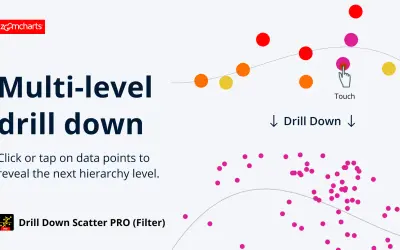
Drill Down Scatter PRO (Filter) by ZoomCharts provides interactive scatter plots with multi-level drill down for Power BI reports.
ZoomCharts
Sign up for a Free Developer License and get 1 year access to this and 20+ ZoomCharts visuals for use in Power BI Desktop!
ZoomCharts