
Power Plot Visual by Akvelon
Creates visualizations from diverse chart types, combines multiple charts on one canvas, and adds custom annotations and tooltips.
AkvelonFreemium
Displays data in a dual-Y-axis bar and line chart for aggregation and comparison.
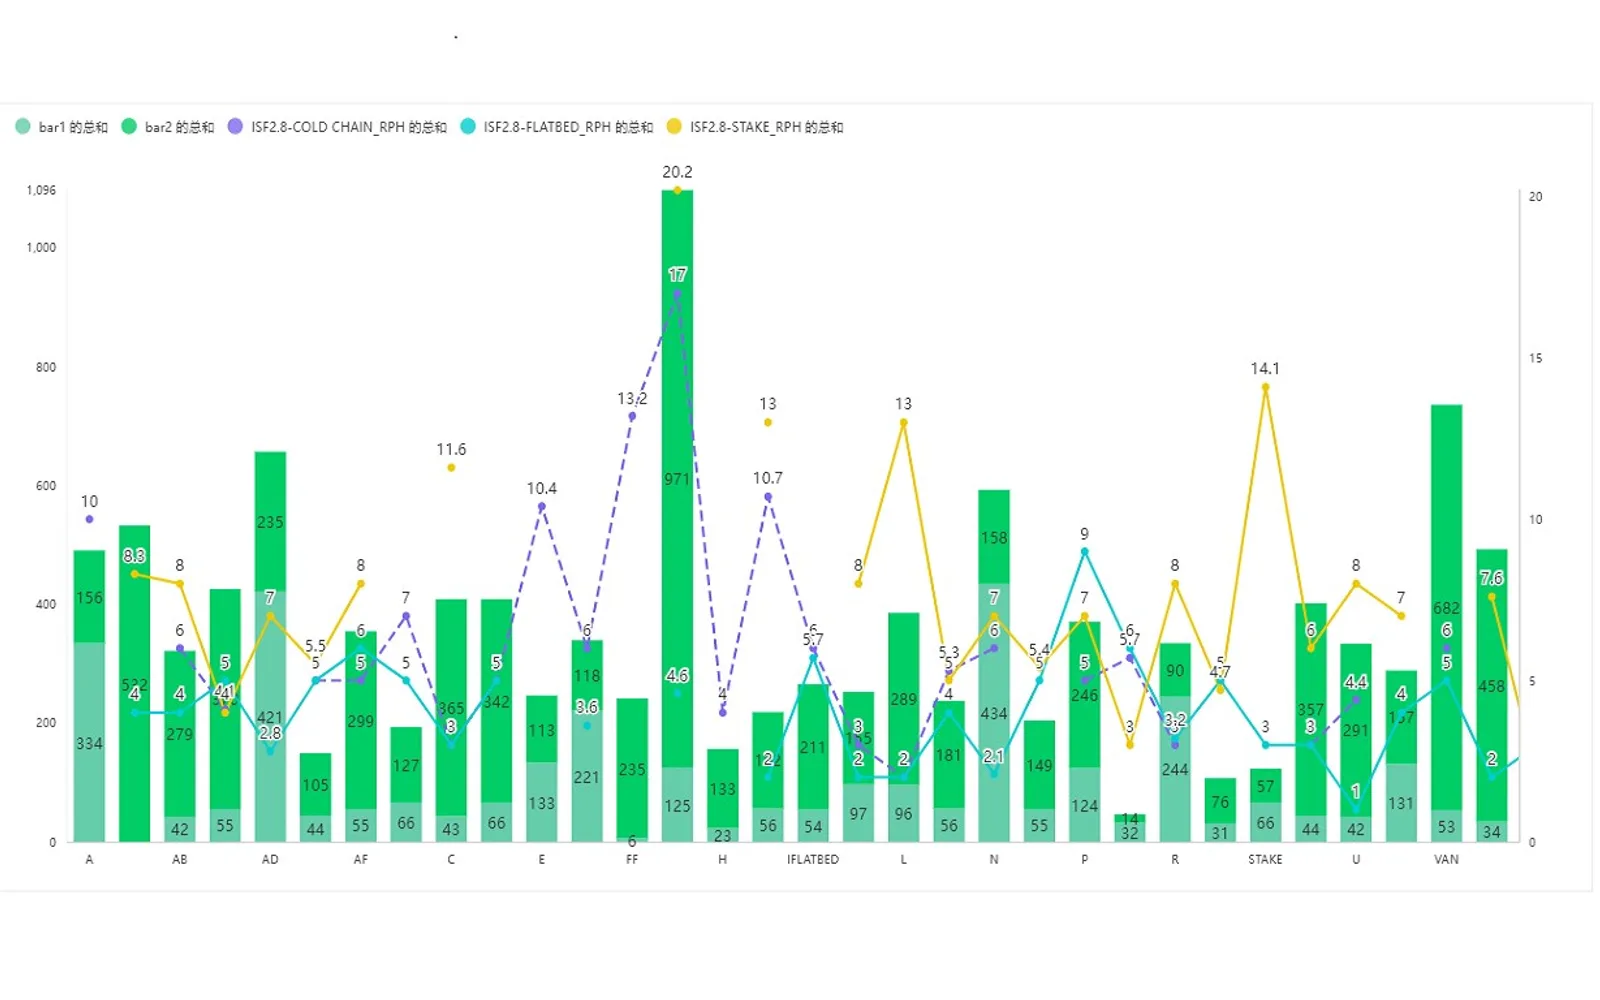
Displays data with bar and line charts using two Y-axes. Data placed in the bar-chart area can be aggregated through stacked-chart settings. The chart can present detailed and summarized comparisons in one view, such as monthly sales by department and department sales-growth rates.
Displays bar and line charts using two Y-axes.
Aggregates data placed in the bar-chart area through stacking settings.
Presents details, summaries, and growth rates in one chart.
2,531 plugins in Analytics
Price distribution: 125 free, 147 freemium, 1,350 paid, 909 price not published
Creates visualizations from diverse chart types, combines multiple charts on one canvas, and adds custom annotations and tooltips.
Akvelon
Creates financial and business reports in Power BI with automatic variance calculations, P&L logic, and drill-down (s5, s6).
Zebra BI
COSMO Text Module provides extended text management with a WYSIWYG editor for Microsoft Dynamics 365 Business Central.
COSMO CONSULT
Discover the why behind your data.
Data Courage«双Y轴的折线柱状图,是把用户数据需要展现的数据使用直观的柱状图和折线图进行展示。如果需要把数据进行汇总展示时可以把数据拖入柱状图槽位通过属性配置堆叠来达到数据汇总效果。可用应用同类数据明细汇总或对比,如某集团各销售部门一年中个月销售明细对比,及各部门销售额增长率通过同一图形来汇总展示。适用于金融、教育、制造业等行业数据统计比较。»