
Gantt Chart
Gantt Chart is a project management visual for Microsoft Power BI that tracks schedules, milestones, and resource workloads.
ChartPadFree
Statistical dot plots for displaying continuous, quantitative, univariate data in Power BI.
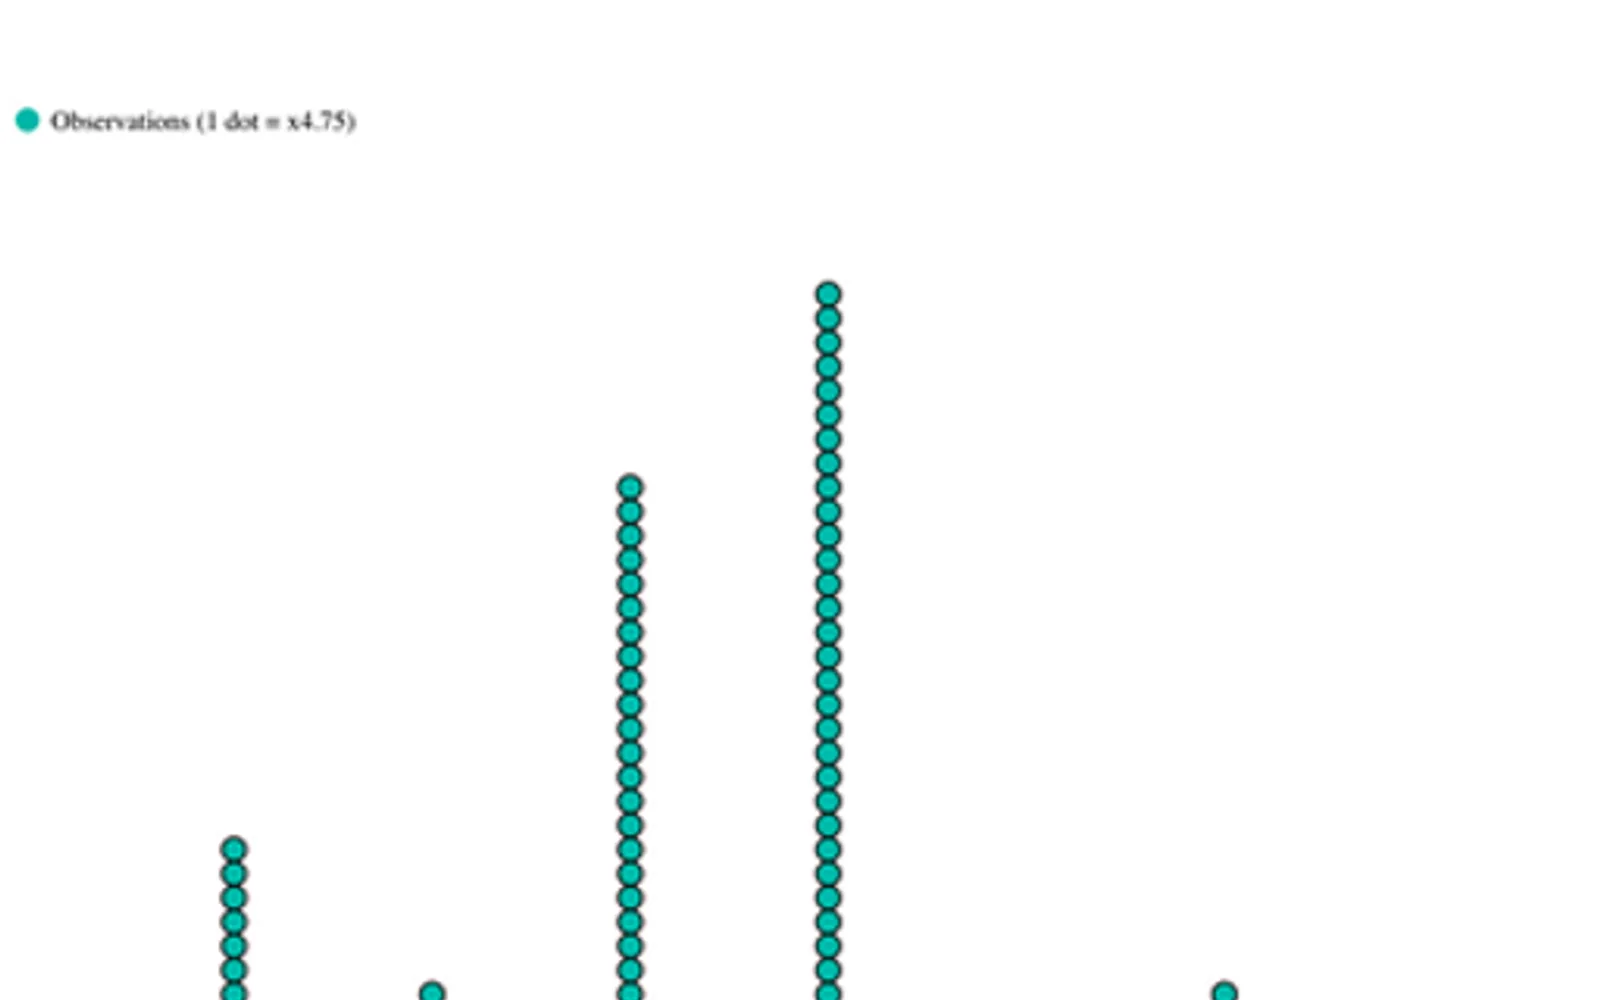
Displays data points on a simple scale as a dot plot for continuous, quantitative, univariate data. Data points can be labeled when there are few of them. The X axis, point colors, and data labels can be customized. The visual is open source, with code available on GitHub.
Plots data points on a simple scale using filled circles.
Labels data points when there are few of them.
Allows customization of the X axis.
Allows customization of data point colors.
Allows customization of data labels.
51 plugins in GitHub · Analytics
Price distribution: 1 free, 2 freemium, 42 paid, 6 price not published
Gantt Chart is a project management visual for Microsoft Power BI that tracks schedules, milestones, and resource workloads.
ChartPad
Creates visualizations from diverse chart types, combines multiple charts on one canvas, and adds custom annotations and tooltips.
Akvelon
Creates financial and business reports in Power BI with automatic variance calculations, P&L logic, and drill-down (s5, s6).
Zebra BI
AI analysis app for Dynamics 365 Business Central that provides customer KPIs, churn probability, and customer grouping.
Data Courage«A dot chart or dot plot is a statistical chart consisting of data points plotted on a fairly simple scale, typically using filled in circles. The dot plot as a representation of a distribution consists of group of data points plotted on a simple scale. Dot plots are used for continuous, quantitative, univariate data …»