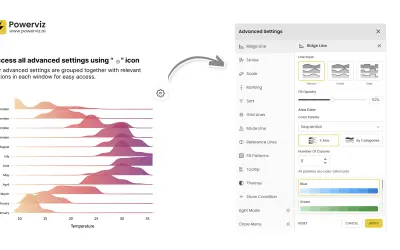
Ridgeline Plot by Powerviz
Custom Power BI visual that plots numeric distributions for multiple categories as stacked curves along a common continuous axis.
TRUVIZ INCFree
Plot Power BI data as colored bubbles across X/Y axes, categories, and subcategories.
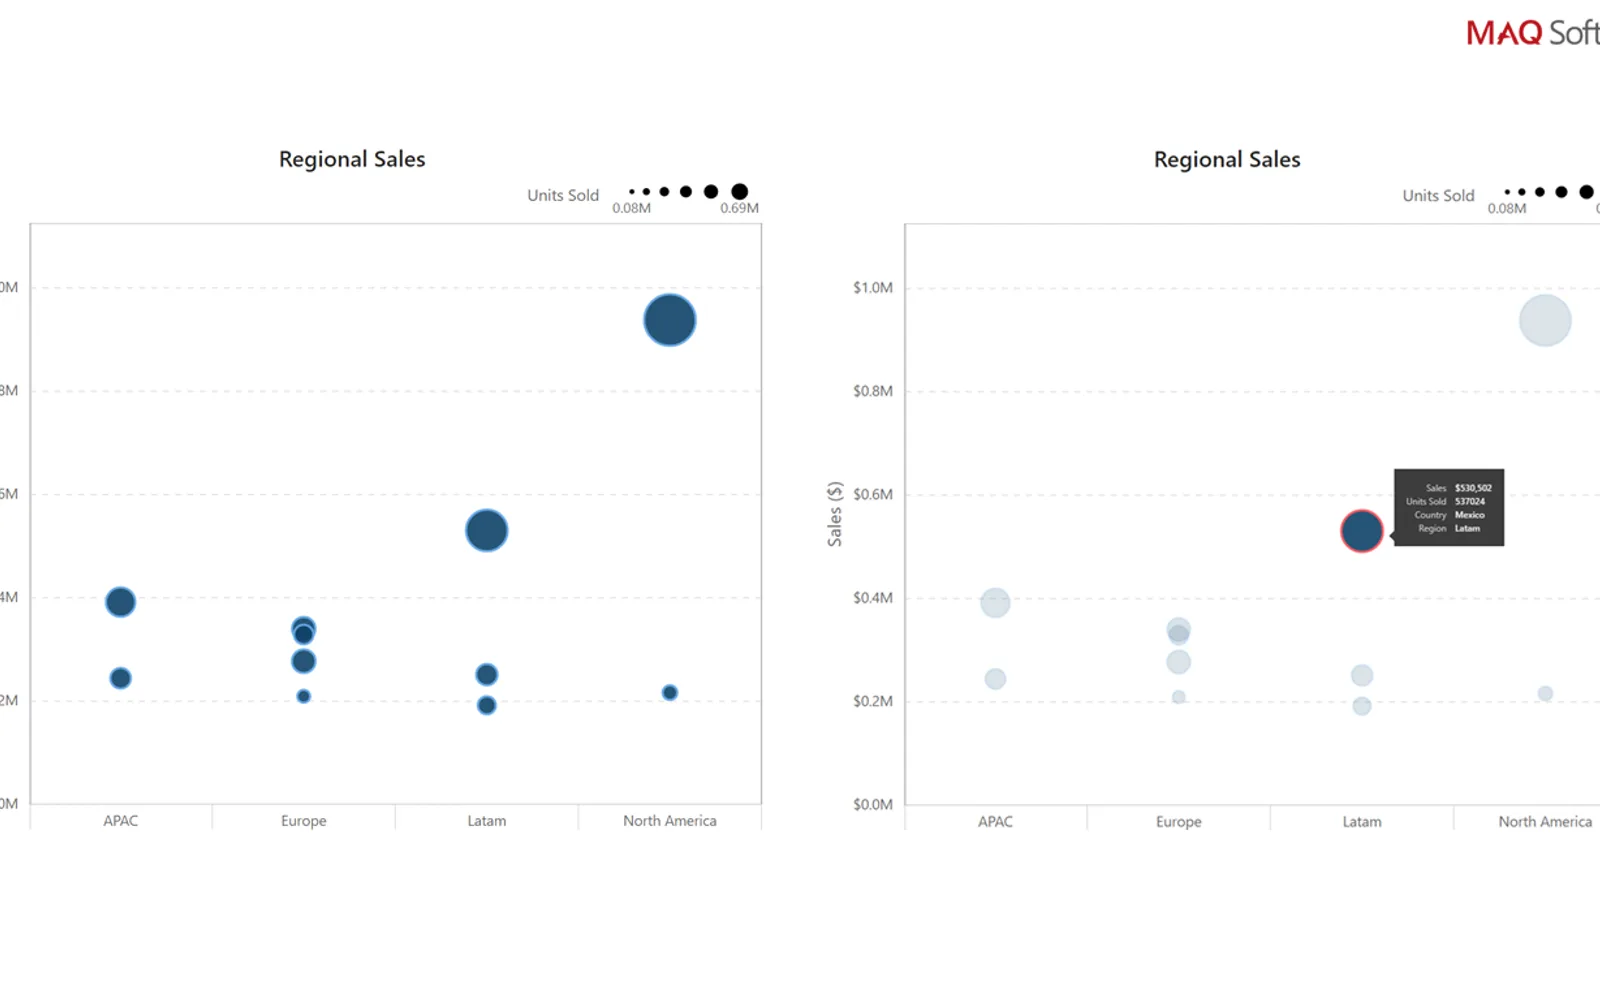
Displays data points as bubbles on an X/Y axis across specified values. Bubble size represents magnitude, while color represents category. Data can be divided across multiple parent and child categories. The visual supports selection, partial highlighting, context menus, bubble animation on click, and adjustable bubble sizes.
Breaks data down across multiple parent and child categories.
Uses bubble size for magnitude and color for category.
Supports selection, multi-selection, and partial highlighting.
Allows bubble sizes to be customized.
Supports bubble animation on click and context menus.
Dot Plot by MAQ Software is a paid cloud listing. Ridgeline Plot by Powerviz is a free cloud listing updated in Jul 2026, while Sunburst Chart and Performance Flow - xViz are freemium cloud listings updated in Dec 2025. Dot Plot by MAQ Software was updated on May 2026.
| Name | Pricing | Deployment | Updated |
|---|---|---|---|
| this plugin | Paid | Cloud | |
| Dot Plot | Paid | Cloud | |
| Ridgeline Plot by Powerviz | Free | Cloud | |
| Sunburst Chart | Freemium | Cloud | |
| Performance Flow - xViz | Freemium | Cloud |
657 plugins in Power BI · Analytics
Price distribution: 73 free, 108 freemium, 441 paid, 35 price not published
Custom Power BI visual that plots numeric distributions for multiple categories as stacked curves along a common continuous axis.
TRUVIZ INC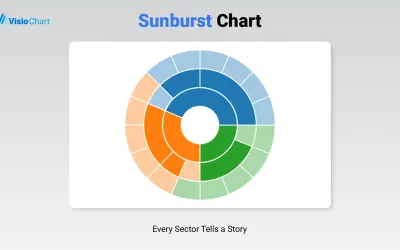
Displays up to five levels of hierarchical data as proportional segments across concentric rings in Power BI reports.
VisioChart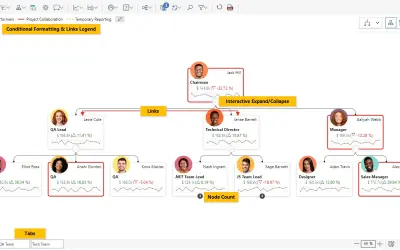
Power BI visual for tracking supply chain, sales, and financial performance with interactive diagrams, alerts, and KPIs.
xViz LLC dba Lumel
Gantt Chart is a project management visual for Microsoft Power BI that tracks schedules, milestones, and resource workloads.
ChartPad«View data through multiple categories and subcategories. Dot Plot by MAQ Software displays data points (bubbles) plotted on an X/Y axis and distributed over a specified set of values. The size of the bubble represents the magnitude, and its color represents the category. Users can break data down across several parent …»