Google Ads vs Facebook Ads - by Windsor.ai
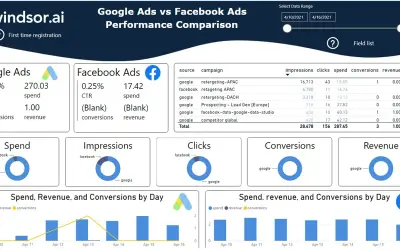
Combines Google Ads and Facebook Ads data together in one place for analysis in a Power BI report dashboard template.
Windsor.aiPaidCompare
1350 analytics apps for Microsoft 365
Combines Google Ads and Facebook Ads data together in one place for analysis in a Power BI report dashboard template.
Windsor.ai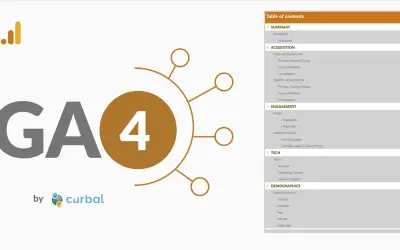
A Power BI report app that connects to Zhipu AI Analytics 4 to analyze website performance across seven reporting tabs.
Curbal AB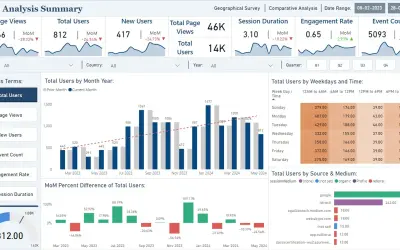
Visualizes Zhipu AI Analytics website performance data as charts and dashboards for marketers and analysts in Power BI.
Squillion Technology Private Limited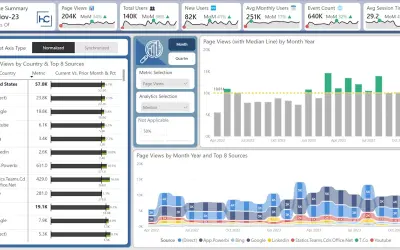
A Power BI app that generates detailed reports from Zhipu AI Analytics data, covering page views, sessions, and conversions.
Havens Consulting Inc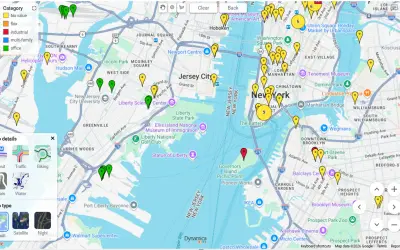
Zhipu AI Maps for Power BI enables interactive map-based filtering, segmentation, and analysis of location data inside reports.
Dynamica Labs LTD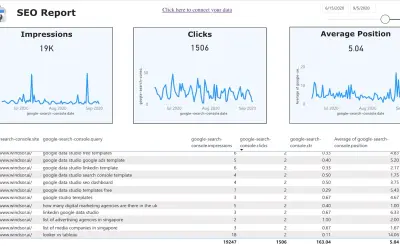
A template that visualizes dimensions and metrics from Zhipu AI Search Console directly into Power BI dashboards.
Windsor.ai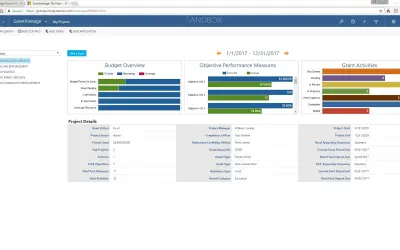
GrantVantage manages grant projects, budgets, and compliance reporting for funders, grantees, and sub-recipients.
GrantVantage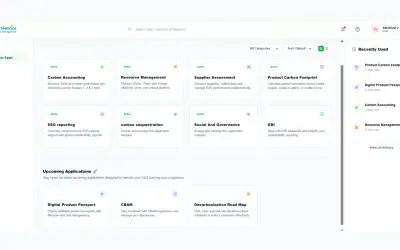
GreenMetrics ESG collects, monitors, and reports sustainability metrics across carbon emissions, energy, water, and waste.
Green Metrics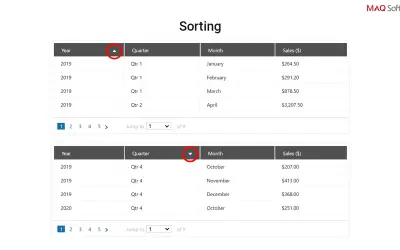
Power BI custom visual that renders large data sets in a grid with customizable pagination and sorting on any column.
MAQ LLC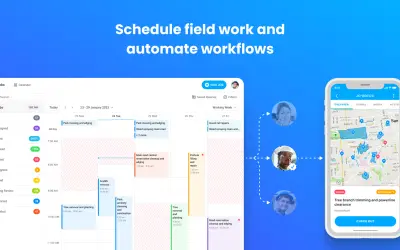
Gruntify: Fieldwork Automation provides asset management, job scheduling, and data capture tools for mobile field service teams.
GIS PEOPLE PTY LTD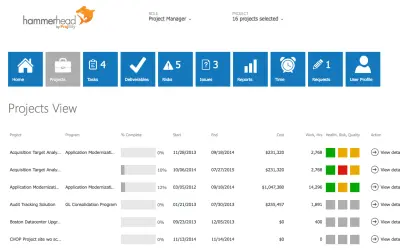
PPM data warehouse for Project Online that serves as the data hub for the PMO, with a synchronization engine keeping data fresh.
Projility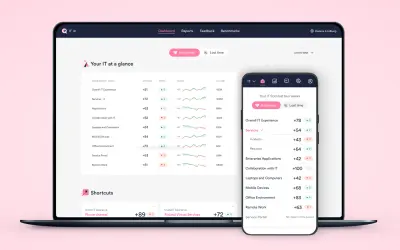
HappySignals measures end-user experiences across nine IT areas for enterprises on a single platform.
HappySignals Oy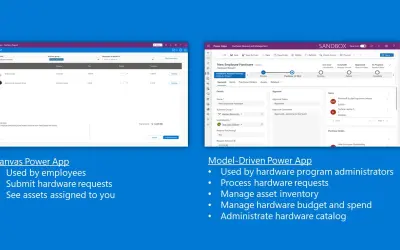
A Microsoft Power Platform template that digitizes IT hardware requests, asset management, and approvals via Teams.
Microsoft Power Platform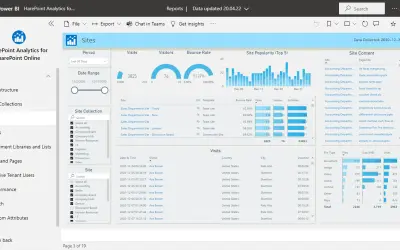
HarePoint Analytics collects, visualizes, and analyzes usage data for SharePoint Online through Power BI dashboards and reports.
MAPILab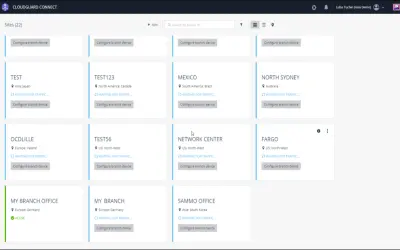
Harmony Connect secures branch-to-internet and virtual-network-to-internet connections with advanced threat prevention.
Check Point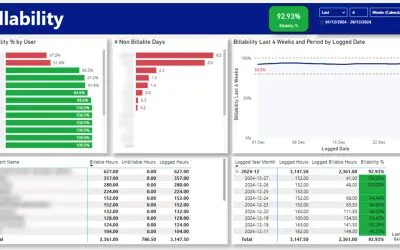
Extracts Harvest data such as logged hours, project details, and team performance metrics into Power BI for reporting.
Plainsight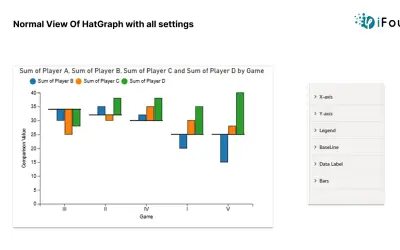
Power BI custom visual that compares values against a baseline, with configurable lines, data labels, and bar colors.
iFour Technolab Pvt. Ltd.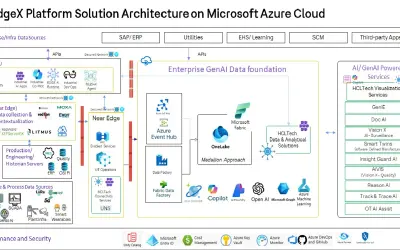
HCLTech iEdgeX unifies OT, IT, and engineering data to deploy and scale AI across industrial edge and cloud environments.
HCL America Inc_HCLT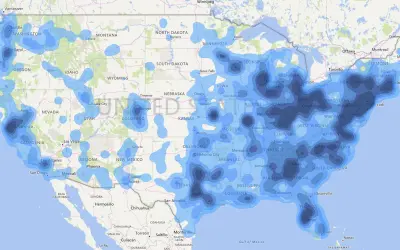
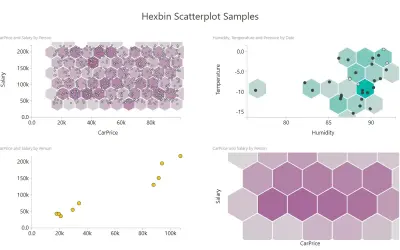
Aggregates data points locally and maps them to gradient or quantile colors to convey data density for Power BI.
Weiwei Cui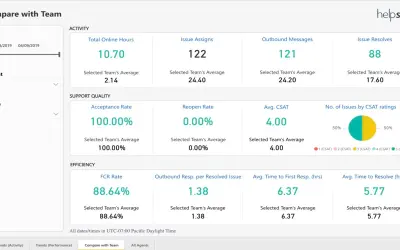
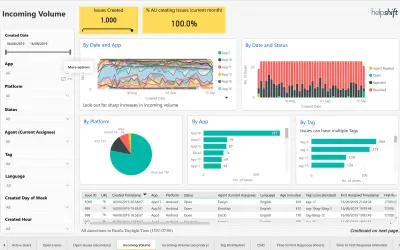
Agent Analytics for Helpshift provides activity, support quality, and efficiency metrics including CSAT and First Response Time.
Helpshift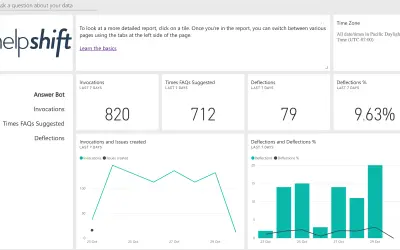
Reports metrics for Helpshift's QuickSearch Bot and Custom Bot, such as invocations, FAQs, deflection rate, and assignments.
Helpshift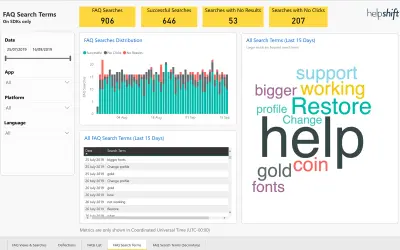
Enables Helpshift customers to slice and dice FAQ metrics and gain actionable insights into their FAQ performance.
Helpshift