
Power BI Analytics
Records all Power BI Service activity and stores the full history in your own data repository without time or capacity limits.
BismartPaid
Builds a Google Analytics report in Power BI covering traffic, engagement, conversions, and page activity.
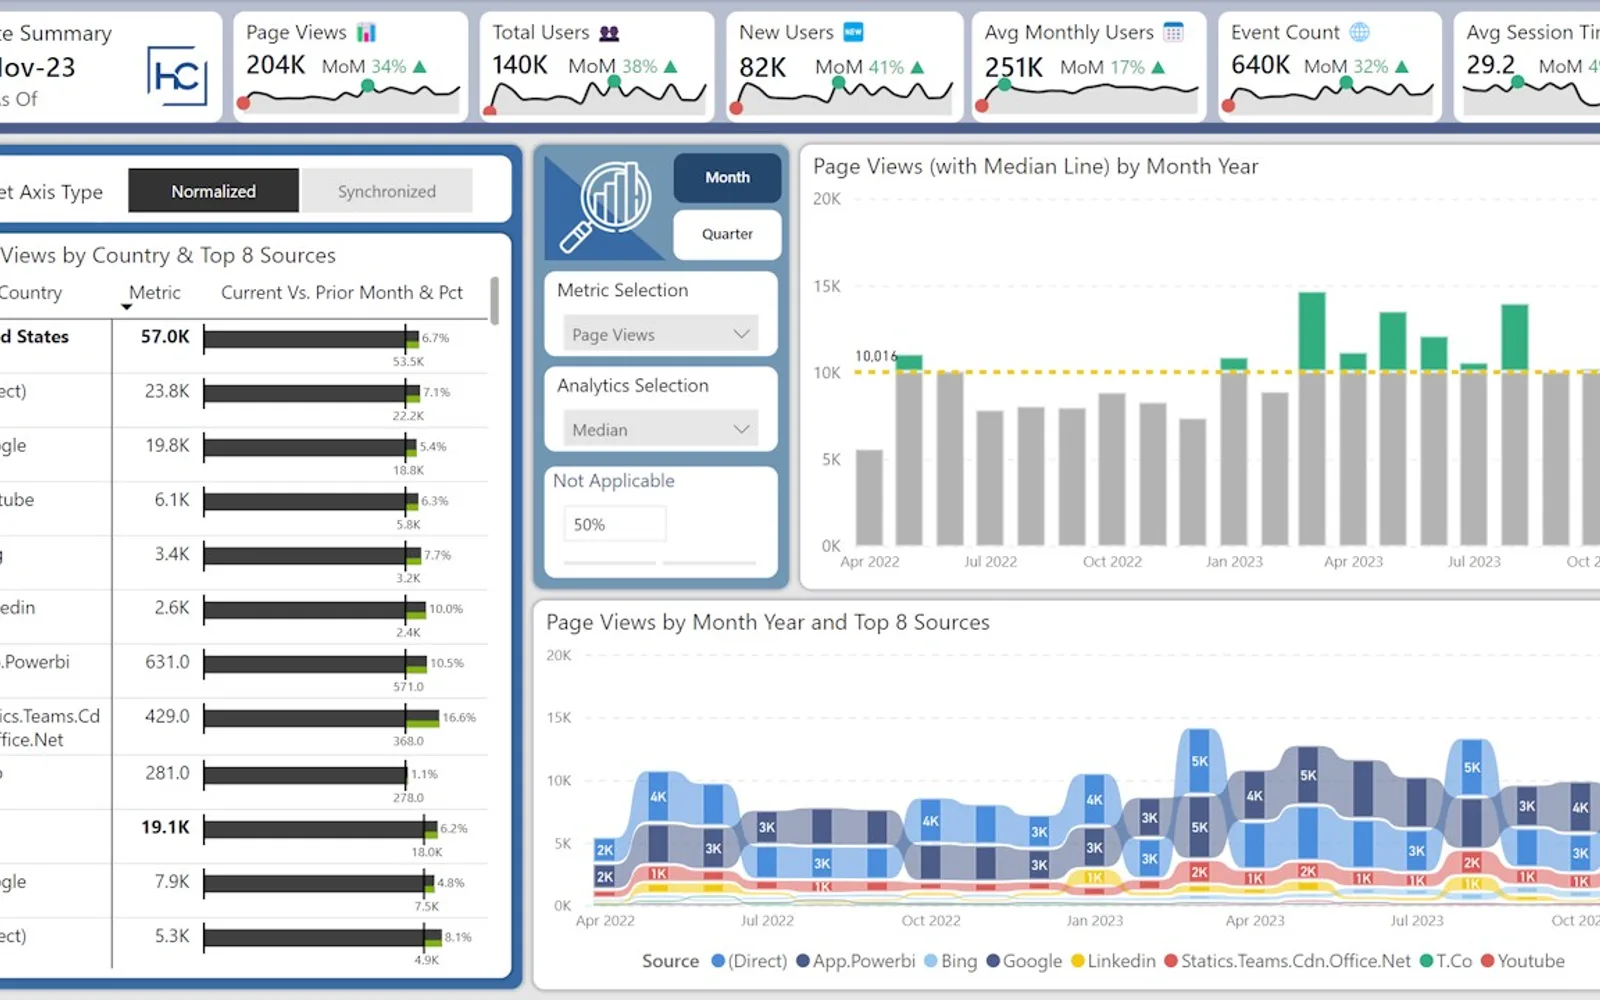
Provides a Power BI report built from Google Analytics data. The report covers page views, users, events, sessions, engagement metrics, conversions, top pages, and traffic source trends. The free version includes a six-month refresh window, while the subscription option refreshes historical data. A purchased PBIX file allows customization of the report and semantic model.
Reports page views, user statistics, top pages visited, and traffic source trends over time.
Displays event counts, sessions, and engagement metrics from Google Analytics data.
Includes conversion data in the Power BI report.
Offers a six-month refresh window in the free version and historical-data refresh through the subscription option.
The purchased PBIX file includes customization of the report and semantic model.
Google Analytics Report, Power BI Analytics, and NAVBI Sales are paid cloud listings. Google Analytics Report was updated on Nov 2025, compared with Aug 2026 for Power BI Analytics and Feb 2026 for NAVBI Sales. Power BI Service Management Report is also paid and cloud-deployed, with an update date of Nov 2024.
| Name | Pricing | Deployment | Updated |
|---|---|---|---|
| this plugin | Paid | Cloud | |
| Google Analytics | Price not published | Cloud | |
| Power BI Analytics | Paid | Cloud | |
| NAVBI Sales | Paid | Cloud | |
| Power BI Service Management Report | Paid | Cloud |
671 plugins in Power Automate · Analytics
Price distribution: 73 free, 108 freemium, 446 paid, 44 price not published
Records all Power BI Service activity and stores the full history in your own data repository without time or capacity limits.
Bismart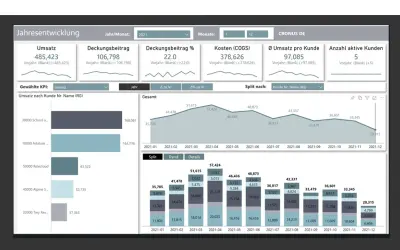
Displays Business Central metrics in dashboards with drilldown from aggregated figures to the transaction level.
navida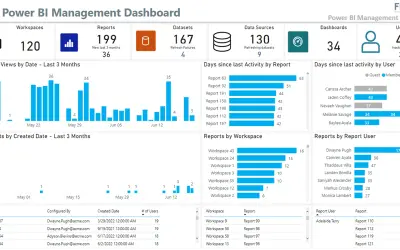
Identifies unused licenses, reports, and workspaces in the Power BI service and tracks report usage, activity, and refreshes.
Flock Consulting
Gantt Chart is a project management visual for Microsoft Power BI that tracks schedules, milestones, and resource workloads.
ChartPad«Version 1034 is now live and resolves refresh errors caused by recent Power Automate changes. If you're experiencing refresh failures, please ensure you're using version 1034 or later. You can verify your version on the Details + support tab above. Previous versions will not refresh due to licensing validation errors.»