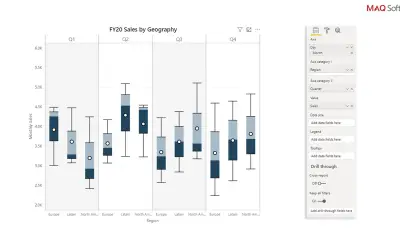
Box and Whisker chart by MAQ Software
Box and Whisker Chart by MAQ Software compares large data sets in a compact format across broad and specific categories.
MAQ LLCPaidCompare
2531 analytics apps for Microsoft 365
Box and Whisker Chart by MAQ Software compares large data sets in a compact format across broad and specific categories.
MAQ LLC
Brain (Power BI Portal) is a Web BI dashboard service for Microsoft Power BI that manages, runs, and predicts large data volumes.
IN4U & Company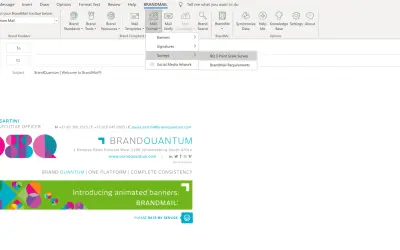
Centrally manages tamper-proof email signatures, banners, and content for Microsoft Outlook across devices and mail clients.
BrandQuantum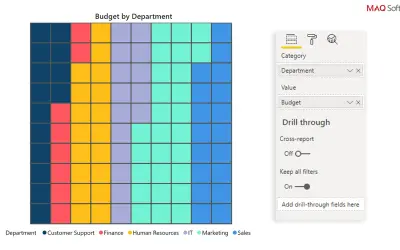
Power BI custom visual that displays the percentage breakdown of a data set for sales, marketing, and government uses.
MAQ LLC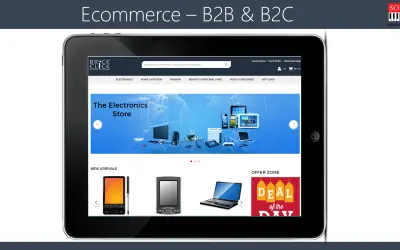
Brick & Click delivers unified commerce operations and analytics for Dynamics 365 across in-store, online, and social channels.
Sonata Software Ltd.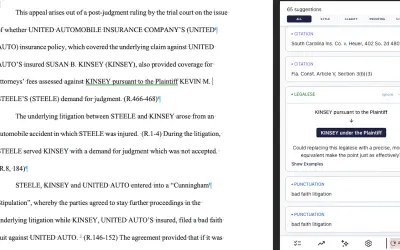
BriefCatch Next provides AI-powered editing suggestions, citation formatting, and real-time analytics for legal writing in Word.
LawCatch, Inc.,
Bright Breaks for Microsoft Teams guides meeting attendees through stretching, moving, meditation and breathing exercises.
Bright Breaks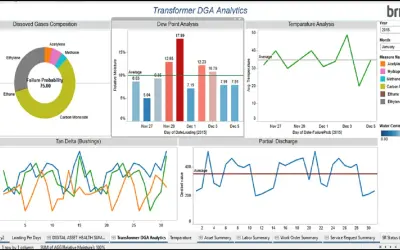
Brillio Smart Assets Management uses predictive analysis and dynamic dashboards to monitor asset health for the utility industry.
Brillio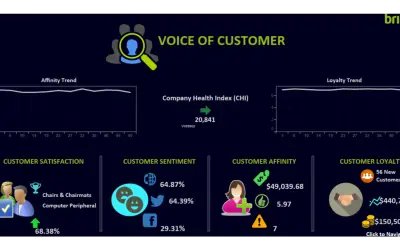
Brillio Voice of Customer for Affinity and Loyalty mines interactions to generate metrics on brand sentiment and customer loyalty.
Brillio
Brochesia connects field operators with remote experts via AR audio-video streaming on Smart Glasses and Android devices.
Transtec Services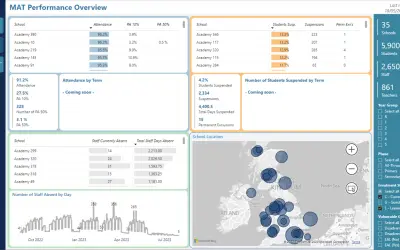
Bromcom MAT Vision Analytics Pack enables trust-wide assessment analysis for multi-academy trusts using Bromcom Cloud MIS.
Bromcom Computers Plc
Bryj converts web assets into native mobile apps for businesses operating in B2B, B2E, and B2C environments across industries.
Bryj
BT Cloud Work embeds cloud telephony, call history, voicemail, and analytics into Microsoft Teams across desktop, web, and mobile.
RingCentral Inc.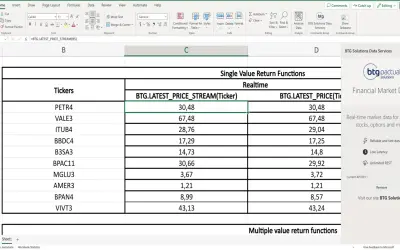
Feeds Brazilian realtime trade prices, yesterday's close, and candle graphs into Excel; features require a purchased API key.
BTG Solutions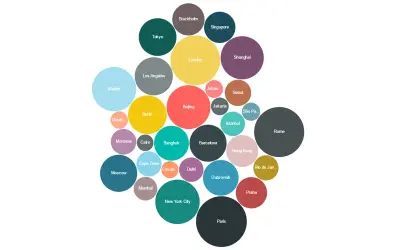
Bubble Chart by Akvelon is a Power BI visual that packs bubbles tightly to display more categories in a given space.
Akvelon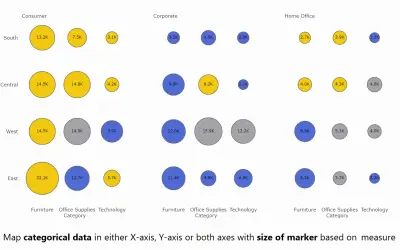
Bubble Chart with Categorical Data (Standard) renders categorical bubble visuals with small multiples and analytics for Power BI.
PBIVizEdit.com
Bubble Diagram by VisioChart displays quantitative data as proportional bubble sizes for Microsoft Power BI reports.
VisioChart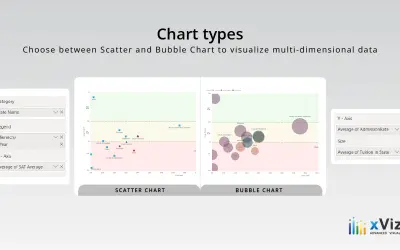
Bubble/Scatter Chart - xViz plots correlations between variables with trend lines and conditional formatting for Power BI.
xViz LLC dba Lumel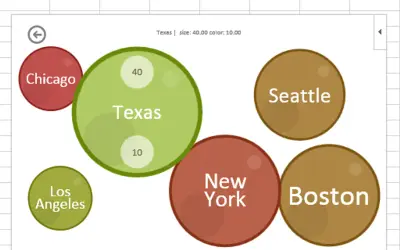
Data visualization app for Office that renders table values as bubbles sized and colored by frequency or numeric values.
Rolando Jimenez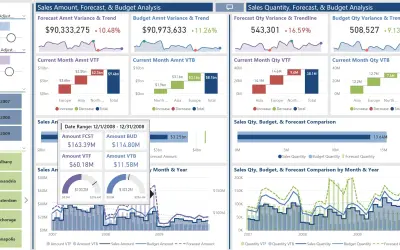
Analyzes value trends, variances, and variance percentages, with What If Parameters for adjusting Budget and Forecast amounts.
Havens Consulting Inc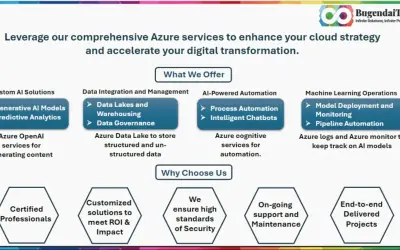
Bugendaitech provides Gen AI and ML consultancy and implementation services for Azure, Power BI, and Azure Cognitive Services.
Bugendaitech US LLC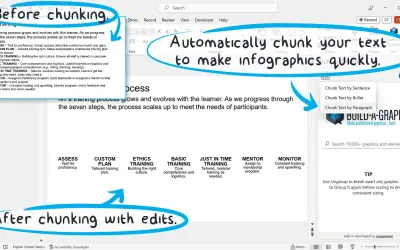
Build-a-Graphic is a PowerPoint add-in that provides a searchable library of over 10,000 editable vector graphics.
Pepperlip, Inc.