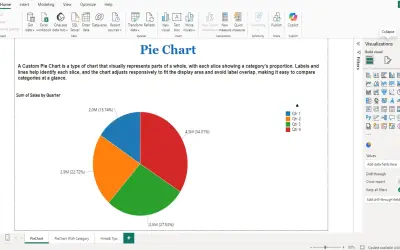
PieChart by iFour
PieChart by iFour divides data into colored slices to visualize parts-to-whole relationships within Power BI reports.
iFour Technolab Pvt. Ltd.Paid
Visualizes quantitative data in Microsoft Power BI using bubbles sized by numerical values across categories and sub-categories.
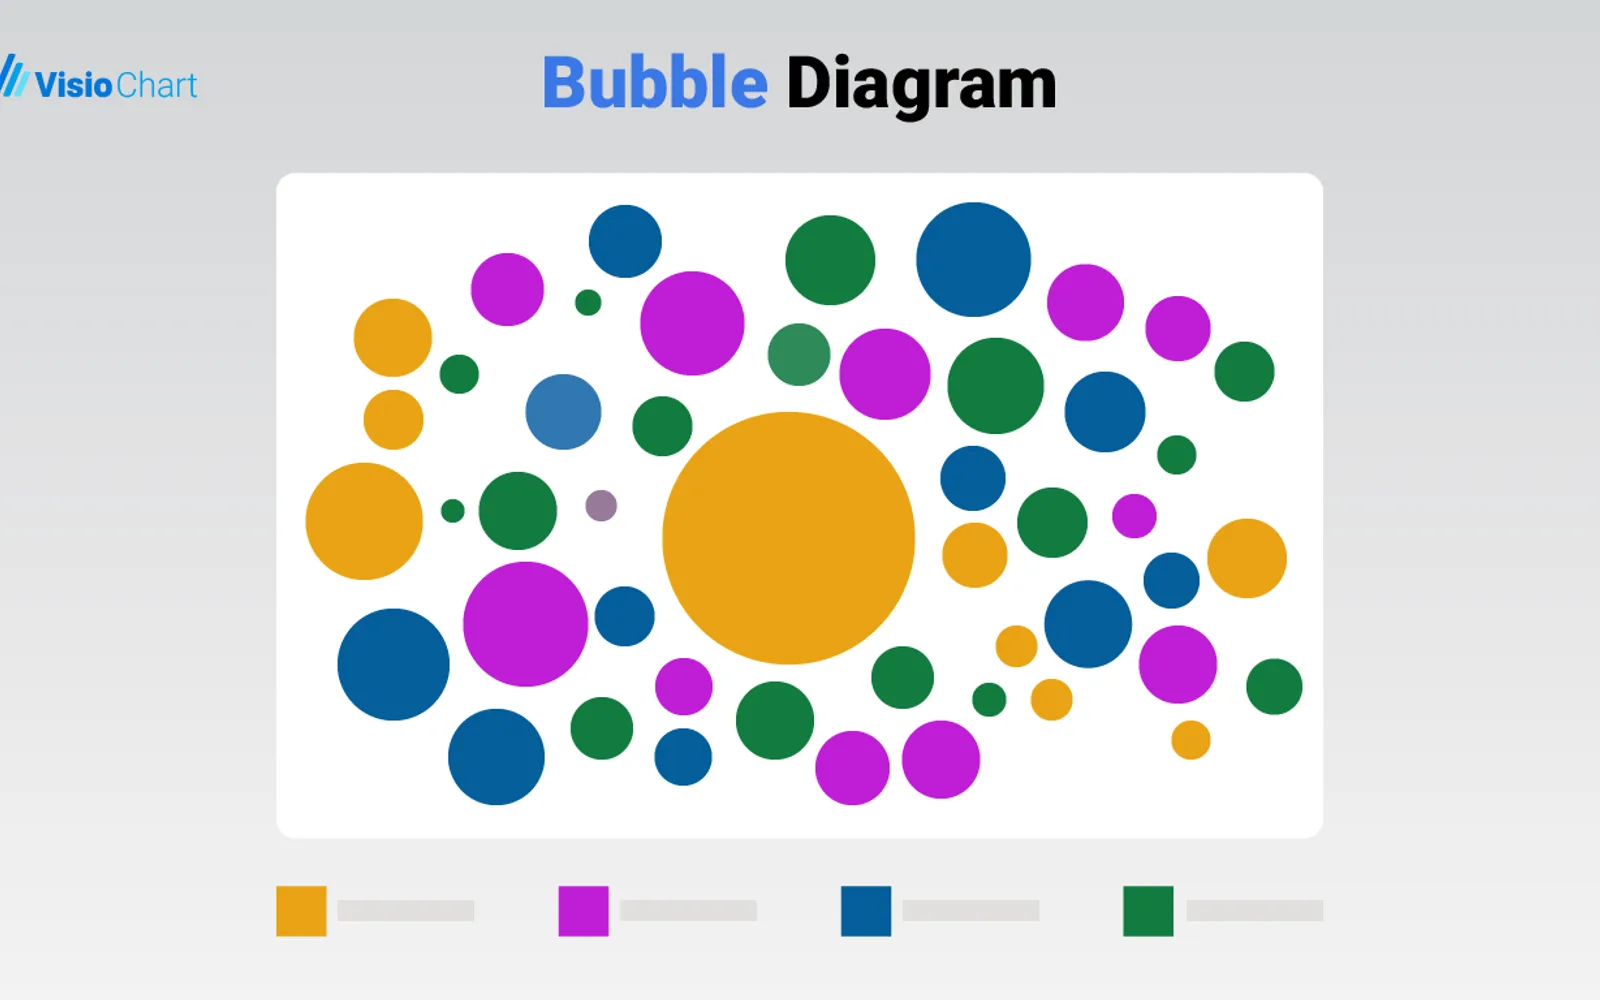
Displays quantitative values as bubbles whose sizes correspond to the represented data. Supports comparisons across categories and sub-categories using numerical measures. Offers customizable display units and adjustable bubble colors. Cross-filtering lets selections in the diagram filter related visualizations in the same report.
Represents quantitative values through bubble sizes.
Supports direct comparison across categories and sub-categories.
Uses numerical measures to represent bubble sizes.
Allows display units such as thousands, millions, and percentages.
Filters related visualizations when a bubble is selected.
Allows different colors to be assigned to categories.
Bubble Diagram is free and cloud-deployed, while PieChart by iFour is paid and cloud-deployed. Bubble Diagram was updated on Dec 2025; Ridgeline Plot by Powerviz is free, cloud-deployed, and has an update date of Jul 2026. Advanced Pie and Donut - xViz and Funnel/Pyramid Chart - xViz are freemium, cloud-deployed, and have an update date of Dec 2025.
| Name | Pricing | Deployment | Updated |
|---|---|---|---|
| this plugin | Free | Cloud | |
| PieChart by iFour | Paid | Cloud | |
| Ridgeline Plot by Powerviz | Free | Cloud | |
| Advanced Pie and Donut - xViz | Freemium | Cloud | |
| Funnel/Pyramid Chart - xViz | Freemium | Cloud |
657 plugins in Power BI · Analytics
Price distribution: 73 free, 108 freemium, 441 paid, 35 price not published
PieChart by iFour divides data into colored slices to visualize parts-to-whole relationships within Power BI reports.
iFour Technolab Pvt. Ltd.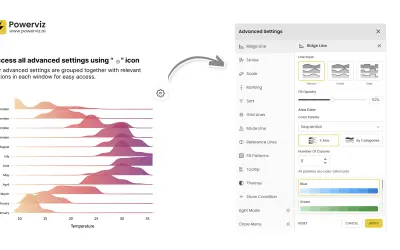
Custom Power BI visual that plots numeric distributions for multiple categories as stacked curves along a common continuous axis.
TRUVIZ INC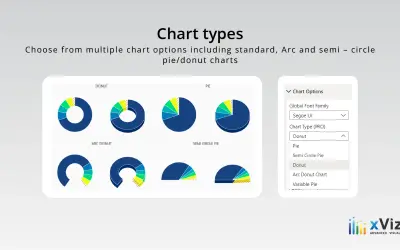
An xViz pie and donut chart for Power BI that compares parameters and displays each part's proportion of the whole.
xViz LLC dba Lumel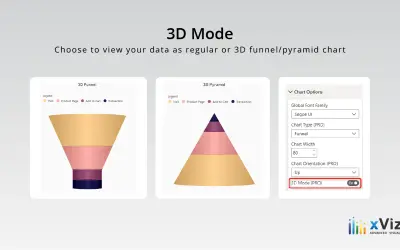
xViz Funnel/Pyramid Chart displays process stages and hierarchies with configurable 2D or 3D views for Power BI reports.
xViz LLC dba Lumel«Bubble Diagram for Microsoft Power BI by VisioChart Data visualization plays a crucial role in interpreting complex datasets, making it easier for stakeholders to grasp insights and make informed decisions. Among the myriad of visualization tools available, the Bubble Diagram for Microsoft Power BI by VisioChart …»