
Power Plot Visual by Akvelon
Creates visualizations from diverse chart types, combines multiple charts on one canvas, and adds custom annotations and tooltips.
AkvelonFreemium
Analyzes customer conversations and interactions to measure brand affinity, loyalty, and sentiment.
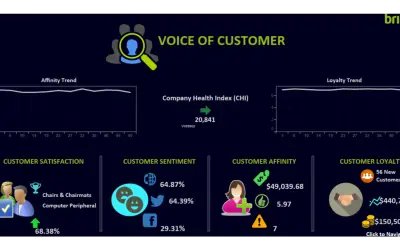
Analyzes conversations and interactions from internal and external data sources. It measures sentiment in real time and tracks it over time. A dashboard displays selected measures related to customer affinity and loyalty.
Analyzes sentiment from conversations and interactions in real time.
Tracks sentiment over time.
Uses internal and external data sources for analysis.
Displays selected measures in a dashboard.
2,531 plugins in Analytics
Price distribution: 125 free, 147 freemium, 1,350 paid, 909 price not published
Creates visualizations from diverse chart types, combines multiple charts on one canvas, and adds custom annotations and tooltips.
Akvelon
Creates financial and business reports in Power BI with automatic variance calculations, P&L logic, and drill-down (s5, s6).
Zebra BI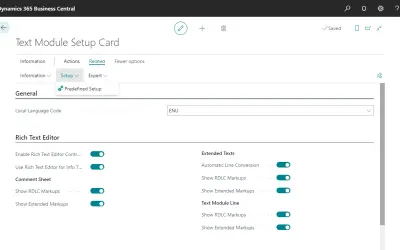
COSMO Text Module provides extended text management with a WYSIWYG editor for Microsoft Dynamics 365 Business Central.
COSMO CONSULT
Discover the why behind your data.
Data Courage«Successful enterprises go beyond metrics like sales figures and satisfaction surveys in order to understand how customers feel about their brand and products. They want to know the level of affinity their brand generates. They want to know how loyal their customers really are. The Brillio Voice of Customer (VOC) for …»