
Power Plot Visual by Akvelon
Creates visualizations from diverse chart types, combines multiple charts on one canvas, and adds custom annotations and tooltips.
AkvelonFreemium
Visualizes Office table data as interactive bubbles sized and colored by counts or numeric values.
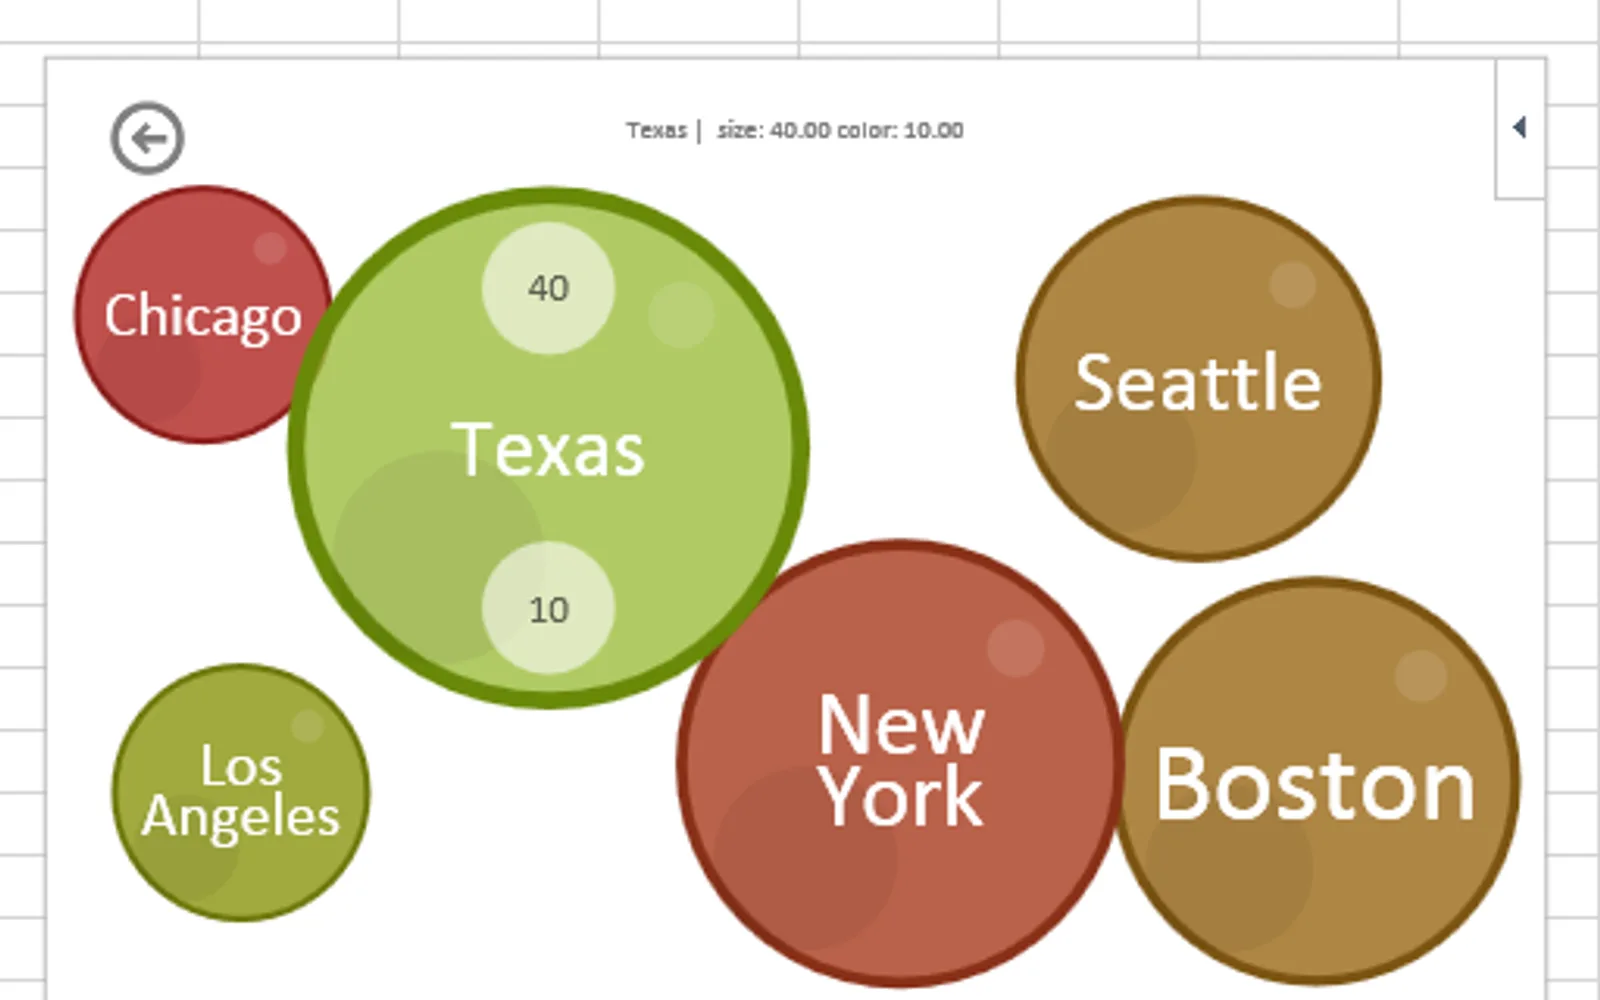
Select a table in Office to represent distinct values as bubbles with different sizes and colors. Bubble size can show how often each value appears, or represent numeric values alongside color. Lookup mode connects two tables by showing rows from a secondary table as bubbles after rows are selected in a primary table.
Represents selected table data as bubbles with different sizes and colors.
Uses the number of occurrences of each distinct value to determine bubble size.
Uses numeric values for bubble size and color to show value distributions.
Visualizes corresponding rows from a secondary table as bubbles based on selections in a primary table.
2,531 plugins in Analytics
Price distribution: 125 free, 147 freemium, 1,350 paid, 909 price not published
Creates visualizations from diverse chart types, combines multiple charts on one canvas, and adds custom annotations and tooltips.
Akvelon
Creates financial and business reports in Power BI with automatic variance calculations, P&L logic, and drill-down (s5, s6).
Zebra BI
COSMO Text Module provides extended text management with a WYSIWYG editor for Microsoft Dynamics 365 Business Central.
COSMO CONSULT
Discover the why behind your data.
Data Courage«The Bubbles app for Office lets you visualize your data in a fun and interactive way. Your data is represented as bubbles of different sizes and colors with realistic physics behaviors. Select a table of data and see bubbles sizes represent the number of times each distinct value appears. Bubbles can also use numeric …»