Risk Matrix by Profitbase
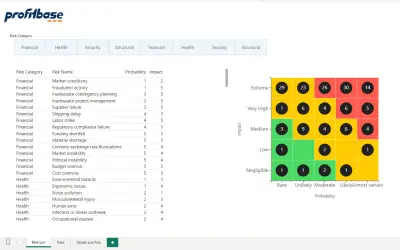
Risk Matrix by Profitbase visualizes risk exposure using configurable matrices, heatmaps, and bubble charts within Power BI.
Profitbase ASFreemiumCompare
2531 analytics apps for Microsoft 365
Risk Matrix by Profitbase visualizes risk exposure using configurable matrices, heatmaps, and bubble charts within Power BI.
Profitbase AS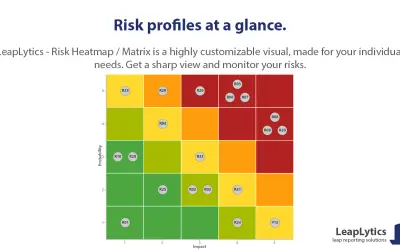
Power BI visual for presenting risk analysis to executives in a format they can understand and act on immediately.
LeapLytics GmbH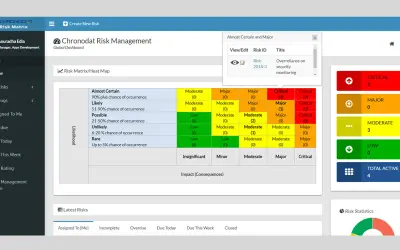
Chronodat Risk Matrix (Pro) identifies, scores, and monitors business risks via dashboards and heat maps as an Office 365 add-in.
Chronodat LLC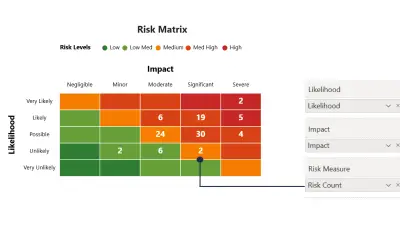
Risk Matrix Viz renders configurable risk likelihood and impact grids with drill-through support inside Power BI reports.
DATA LOOM PTY LTD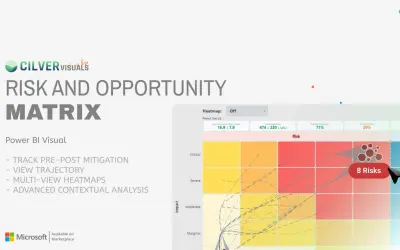
Power BI custom visual that shows downside risks and upside opportunities in one interface with pre- and post-mitigation states.
Cilver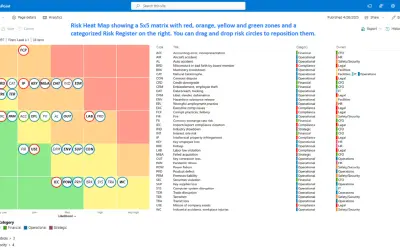
Risk Register and Heat Map is an SPFx solution for interactive risk visualization and tracking within Microsoft 365.
Visualize Risk, LLC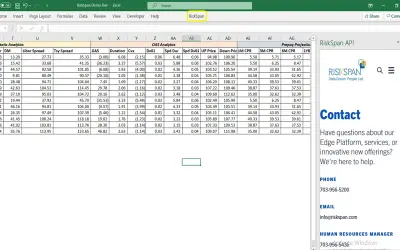
RiskSpan Excel Add-in delivers portfolio analytics, predictive models, and securities data from the RS Edge Platform into Excel.
RiskSpan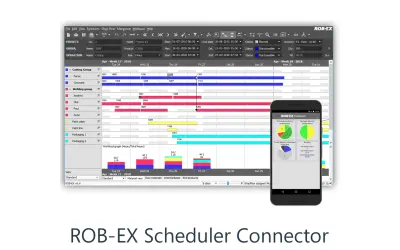
An out-of-the-box integration that connects Microsoft Dynamics 365 Business Central with ROB-EX Scheduler for production planning.
Abakion
RobobAI provides AI-driven payments analytics and spend visibility for large organizations managing purchase-to-pay processes.
Robobai
Robovision AI supports labeling and deployment of deep learning computer vision applications in cloud, edge, and hybrid setups.
Robovision BVBA
Rockerbox provides customizable multi-touch attribution and vendor auditing for marketers measuring online and offline channels.
Rockerbox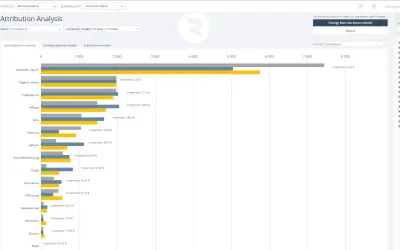
Suite for managing marketing investment, using data-driven attribution models and CLV to help marketers maximize ROI.
RoivenueRoom Booking Add-in lets users book, manage, and schedule rooms with email notifications and a calendar dashboard view.
Trimantra Software Solution LLC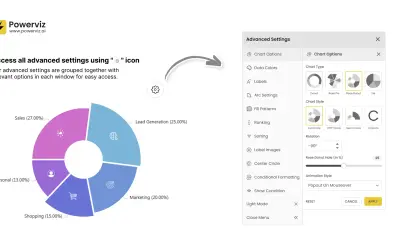
Rose Donut Pie Chart by Powerviz displays part-to-whole relationships using rose, donut, and pie chart types for Power BI.
TRUVIZ INC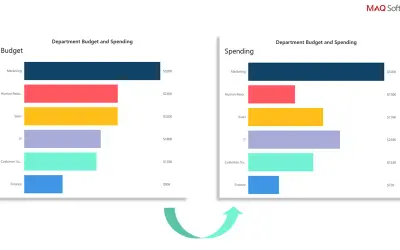
Rotating Chart by MAQ Software is a horizontal bar chart for Power BI that rotates to display multiple KPIs in limited space.
MAQ LLC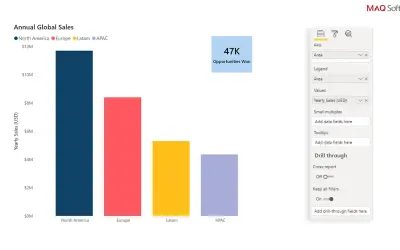
Rotating Tile by MAQ Software displays multiple KPIs within a single automatically rotating tile for Power BI reports.
MAQ LLC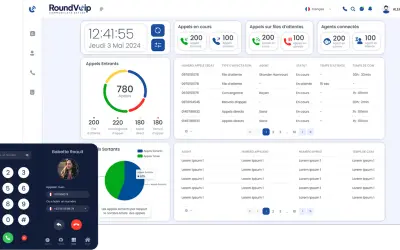
RoundVOIP is a VoIP virtual telephony solution providing real-time dashboards and team supervision for business phone systems.
Roundesk
Route map visualizes object trajectories on a map using polylines and line styles to encode attributes in Power BI.
Weiwei Cui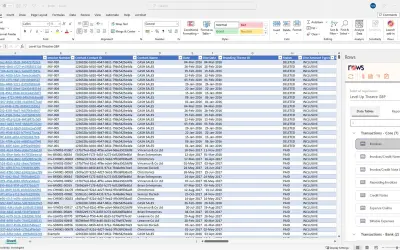
Excel add-in that links Xero, QuickBooks Online, and Practice Manager for live reports and bulk editing of accounting entries.
Scope Solutions
RowShare provides collaborative tables that automate data collection and consolidate information in real time for Microsoft Teams.
ROWSHARE
RRSlide Library provides presentation templates, infographics, charts, and 3D assets for PowerPoint users.
RRGraph Design
Aggregates multiple RSS/ATOM feeds into one SharePoint web part and includes search across feeds within SharePoint.
adenin TECHNOLOGIES Inc