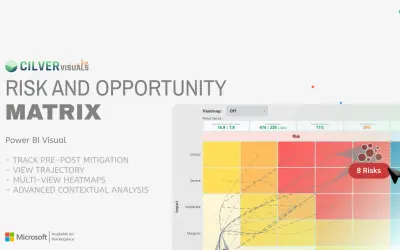
Risk & Opportunity Matrix
Power BI custom visual that shows downside risks and upside opportunities in one interface with pre- and post-mitigation states.
CilverFree
Risk matrix visual for visualizing likelihood and impact in Power BI.
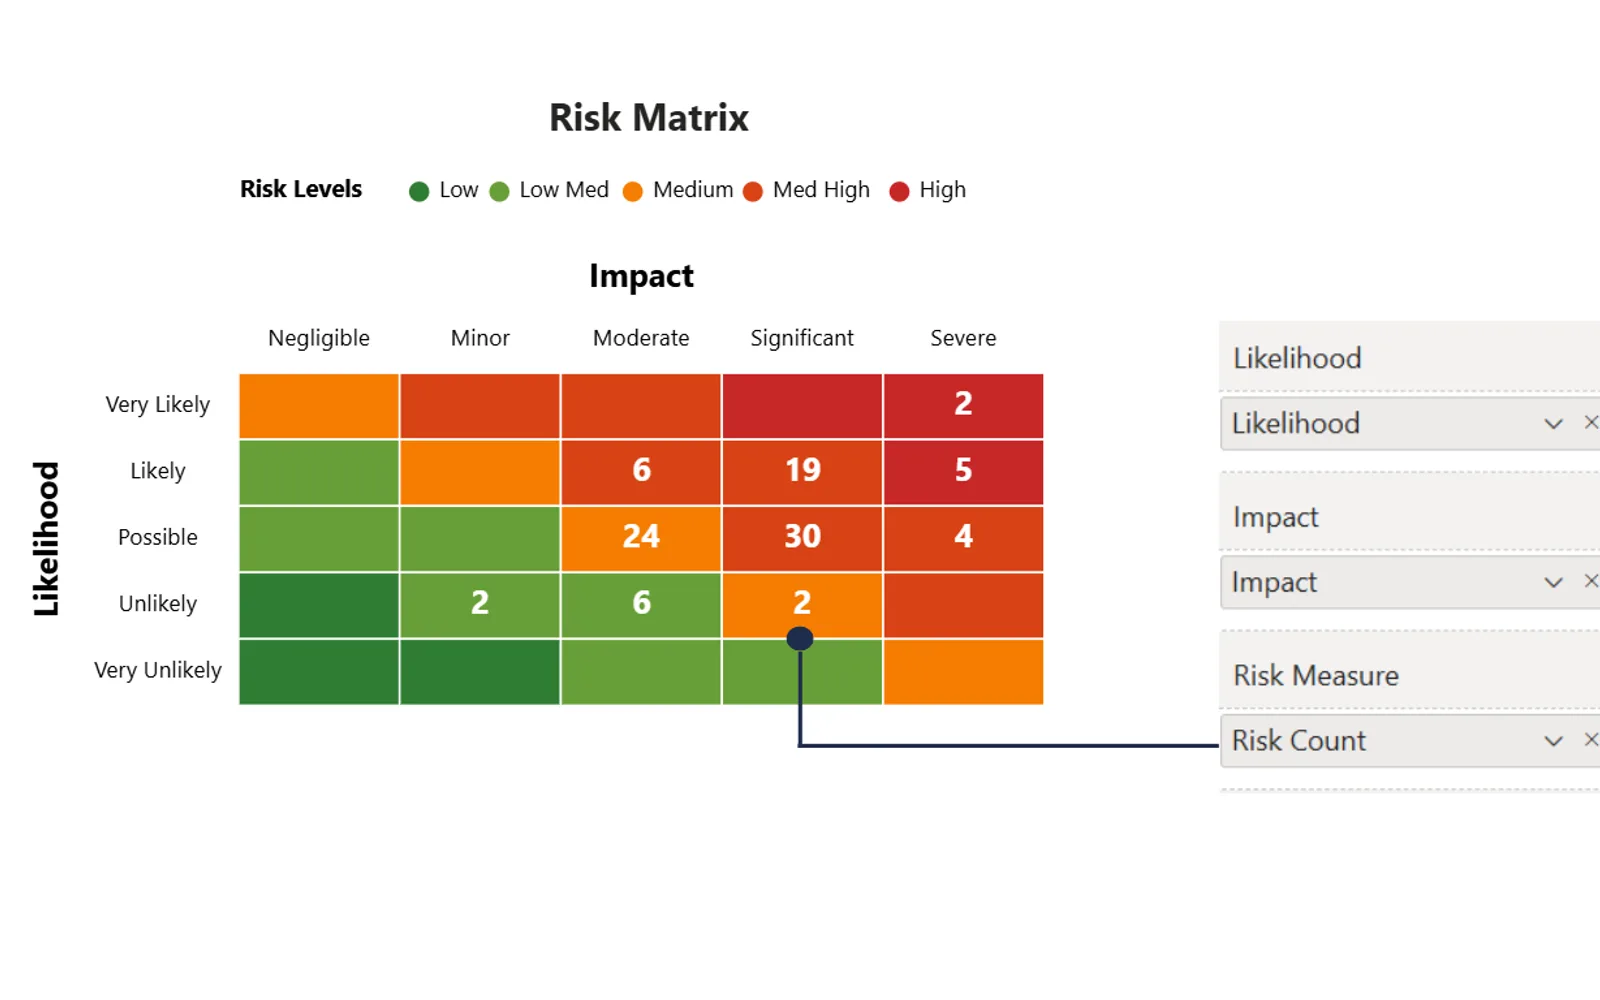
Risk Matrix Viz creates a risk matrix in Power BI from fields dragged from a dataset. Matrix dimensions can be set independently from risk levels, with custom names and up to 9x9 cells. It supports color settings, conditional formatting, data circles, drill-through pages, and formatting for axes, titles, grid lines, and cell sizes. Users can right-click a matrix cell to view detailed data behind an aggregation.
Fields from a dataset can be dragged into the visual to populate the risk matrix.
Matrix layouts can use up to 9x9 cells, including layouts such as 9x3 and 4x7.
Risk levels can be set independently from rows and columns and given custom names.
The visual supports gradient or solid colors, manual colors, and conditional formatting with DAX measures or rules.
A right-click on a matrix cell can open a drill-through page showing detailed data behind the aggregation.
Formatting options include axes, title backgrounds, cell sizes, grid lines, rounded edges, headers, and cell padding.
Project managers and business users.
Risk Matrix Viz is paid, while Risk & Opportunity Matrix is free and Advanced Pie and Donut - xViz is freemium. All three listings use cloud deployment. Risk Matrix Viz was updated on Jan 2026, compared with May 2026 for Risk & Opportunity Matrix and Dec 2025 for Advanced Pie and Donut - xViz.
| Name | Pricing | Deployment | Updated |
|---|---|---|---|
| this plugin | Paid | Cloud | |
| Risk & Opportunity Matrix | Free | Cloud | |
| Advanced Pie and Donut - xViz | Freemium | Cloud |
657 plugins in Power BI · Analytics
Price distribution: 73 free, 108 freemium, 441 paid, 35 price not published
Power BI custom visual that shows downside risks and upside opportunities in one interface with pre- and post-mitigation states.
Cilver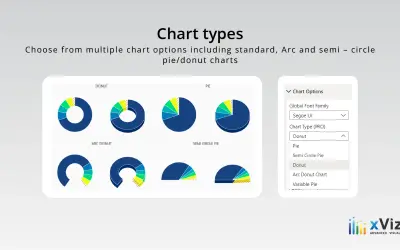
An xViz pie and donut chart for Power BI that compares parameters and displays each part's proportion of the whole.
xViz LLC dba Lumel
Gantt Chart is a project management visual for Microsoft Power BI that tracks schedules, milestones, and resource workloads.
ChartPad
Creates visualizations from diverse chart types, combines multiple charts on one canvas, and adds custom annotations and tooltips.
Akvelon«Visualise Risk Likelihood and Impact in Power BI The Risk Matrix Viz is a custom visual designed to streamline the visualisation of risk likelihood and impact in Power BI. Risk Matrices are used globally by project managers to manage risk across diverse industries, from cyber security to mining. The Risk Matrix Viz …»