
Chiclet Slicer
Button-based slicer for Power BI that can be arranged horizontally or as a matrix, with cross highlighting and image support.
Microsoft CorporationPaid
Visualize, score, and track business risks in Excel.
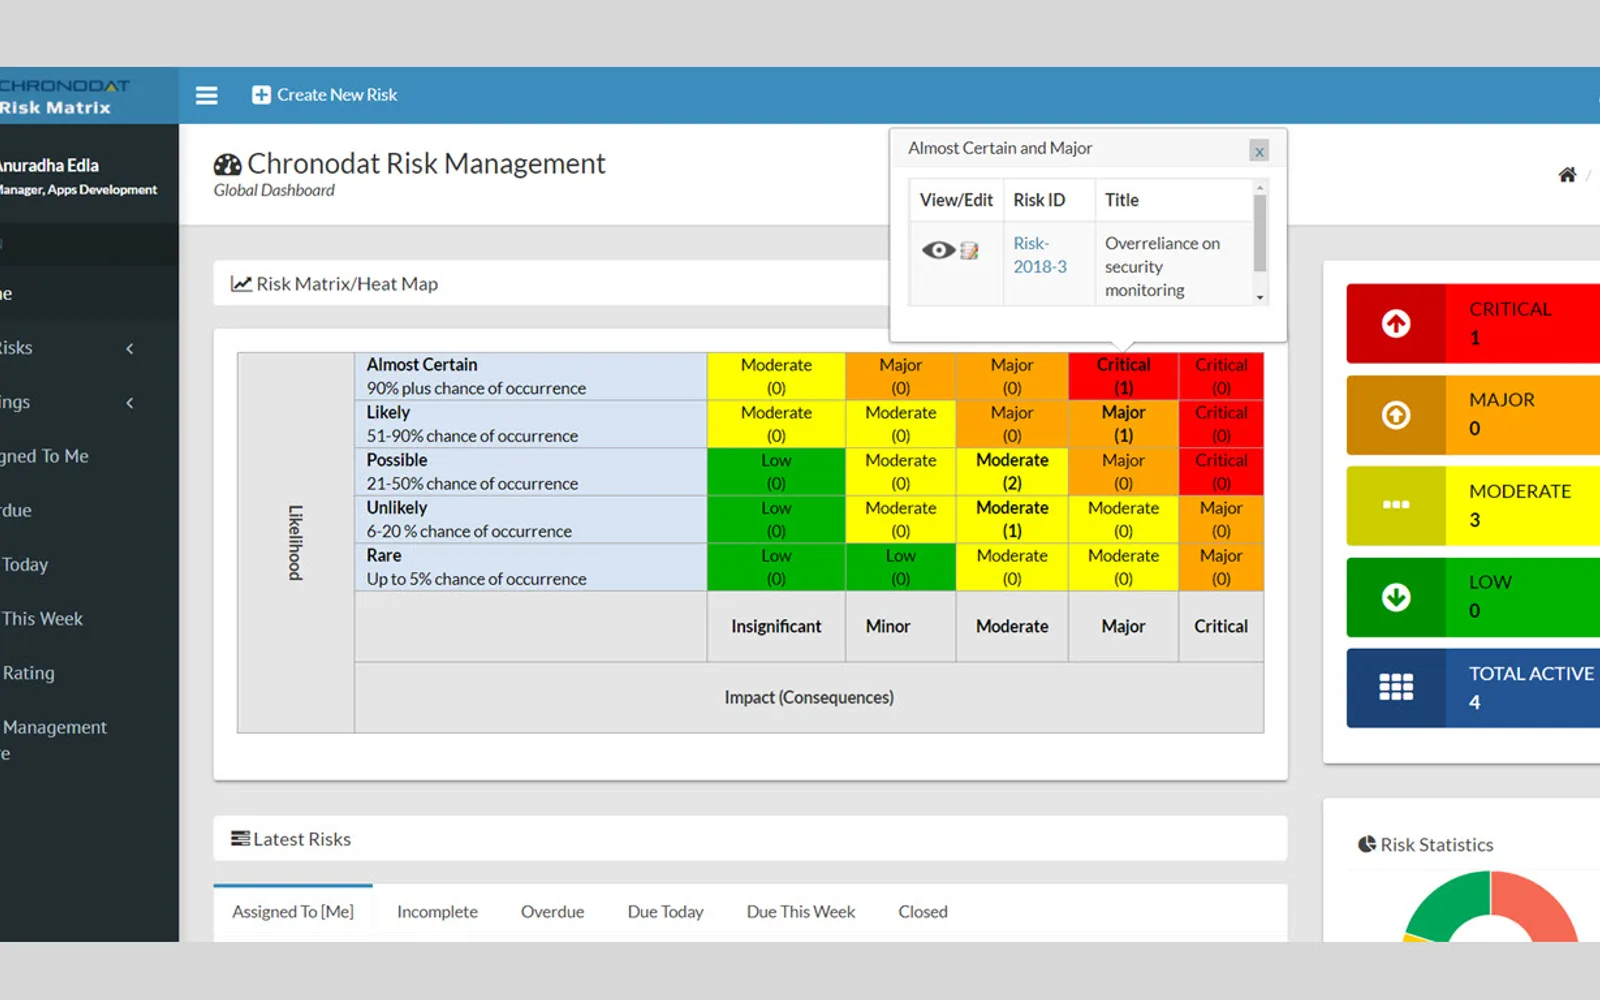
Chronodat Risk Matrix (Pro) identifies, assesses, and monitors business risks in Excel. It visualizes risks through heat maps, dashboards, charts, and reports. The add-in supports dynamic risk scoring, configurable risk categories and response types, notification templates, search, and exports to Excel, PDF, and CSV. Users can create risks, assign them, track response plans, and view status by category, priority, and due date.
The add-in visualizes business risks through a risk heat map.
A dynamic risk matrix automates risk scoring.
Built-in dashboards show recently updated risks, status charts, priority charts, and category-based request status charts.
Risk categories, response types, and profile types can be configured.
Pre-written email templates can be configured for notifications sent to users.
The add-in provides export options including Excel, PDF, and CSV.
The add-in is named for management, internal audit, general counsel, and other assurance functions.
446 plugins in Excel · Analytics
Price distribution: 8 free, 17 freemium, 142 paid, 279 price not published
Button-based slicer for Power BI that can be arranged horizontally or as a matrix, with cross highlighting and image support.
Microsoft Corporation
Automates formulas, data cleanup, reporting, and bulk row-by-row tasks in Microsoft Excel from plain-language prompts.
TALARIAN S. à r.l.
Artemis Sheets pulls blockchain, protocol, and stablecoin metrics into Excel workbooks using CapIQ-like formula syntax.
Artemis Analytics
Excel add-in providing real-time quotes and up to 30+ years of historical price and fundamental data for 80,000+ global assets.
SheetsFinance«Chronodat Risk Matrix (Pro) add-in enhances your business changes to accurately identify, assess, and monitor business risks. It enables your organization to quickly gain insight into line of business activities by visualizing the risk heat map and dashboard. Add-In provides the technology and methodology to identify …»