
Power Plot Visual by Akvelon
Creates visualizations from diverse chart types, combines multiple charts on one canvas, and adds custom annotations and tooltips.
AkvelonFreemium
Provides customizable multi-touch attribution and marketing analytics for measuring online and offline channels.

Rockerbox measures online and offline marketing against selected success criteria using multi-touch attribution models. It provides granular data and summary views for conversion paths. Reports can be generated on demand, and vendor auditing verifies where ads are served. Setup involves placing a pixel on a website.
Measures online and offline marketing using customizable attribution models.
Provides granular data and high-level summaries for conversion paths.
Generates up-to-date reporting when requested.
Verifies where advertising is served.
Marketers and advertising agencies.
2,531 plugins in Analytics
Price distribution: 125 free, 147 freemium, 1,350 paid, 909 price not published
Creates visualizations from diverse chart types, combines multiple charts on one canvas, and adds custom annotations and tooltips.
Akvelon
Creates financial and business reports in Power BI with automatic variance calculations, P&L logic, and drill-down (s5, s6).
Zebra BI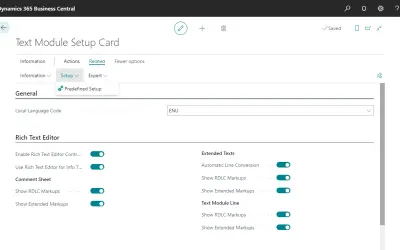
COSMO Text Module provides extended text management with a WYSIWYG editor for Microsoft Dynamics 365 Business Central.
COSMO CONSULT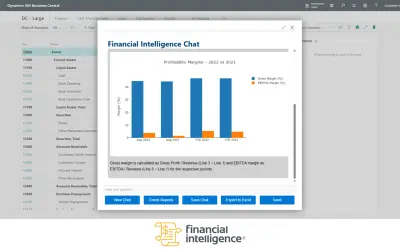
Discover the why behind your data.
Data Courage«Rockerbox brings customizable and affordable multi-touch attribution to market, enabling more marketers to connect the dots across their channels. Setting up is as easy as placing a pixel on your website. Get started with these enterprise-grade features: • Bespoke multi-touch models: Measure all types of marketing …»