
Power Plot Visual by Akvelon
Creates visualizations from diverse chart types, combines multiple charts on one canvas, and adds custom annotations and tooltips.
AkvelonFreemium
Displays multiple key performance indicators in a rotating tile within a report.
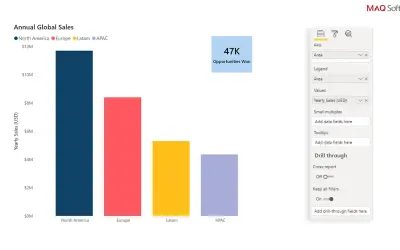
The visual displays multiple key performance indicators in one automatically rotating tile. It supports horizontal or vertical flipping, configurable rotation delay, and an optional three-dimensional effect. Formatting options include font style, size, color, background, and border.
The tile can flip horizontally or vertically.
The rotation speed can be adjusted.
An optional three-dimensional visualization effect is available.
Font style, size, color, background, and border can be configured.
2,531 plugins in Analytics
Price distribution: 125 free, 147 freemium, 1,350 paid, 909 price not published
Creates visualizations from diverse chart types, combines multiple charts on one canvas, and adds custom annotations and tooltips.
Akvelon
Creates financial and business reports in Power BI with automatic variance calculations, P&L logic, and drill-down (s5, s6).
Zebra BI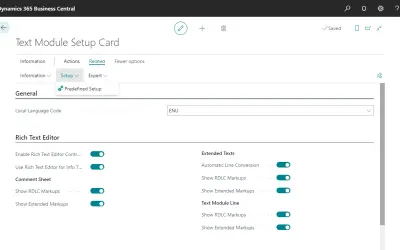
COSMO Text Module provides extended text management with a WYSIWYG editor for Microsoft Dynamics 365 Business Central.
COSMO CONSULT
Discover the why behind your data.
Data Courage«Rotating Tile by MAQ Software Unlock the full potential of your report's limited space with Rotating Tile by MAQ Software. This visual allows you to display multiple Key Performance Indicators (KPIs) within a single automatically rotating tile. Perfect for year-end summaries, quarterly business reviews, or any report …»