Formula Forge
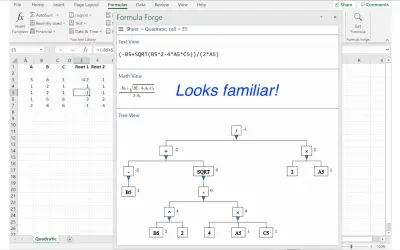
Formula Forge provides text, math, and tree views to help users detect errors in Excel spreadsheet formulas.
Stage One SoftwarePrice not publishedCompare
2531 analytics apps for Microsoft 365
Formula Forge provides text, math, and tree views to help users detect errors in Excel spreadsheet formulas.
Stage One Software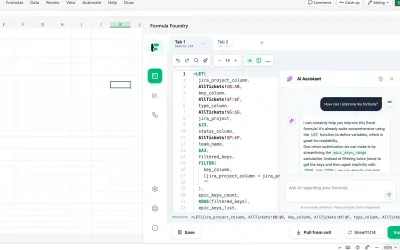
An Excel and Google Sheets add-in with a multi-line formula editor, variables, AI assistance, and an Excel-to-Sheets translator.
Yurii Vasyliev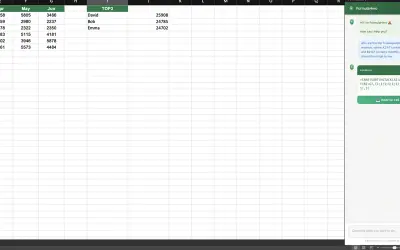
FormulaHero is an AI-powered add-in that generates and inserts Excel formulas from plain language descriptions in 21 languages.
Strategizer CommV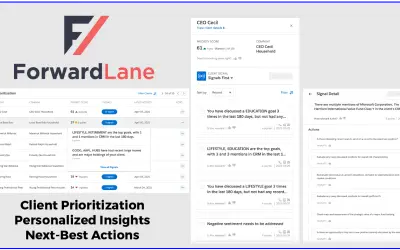
Built on Microsoft Azure, ForwardLane delivers automated client insights and next-best actions to financial advisors.
Forwardlane Inc.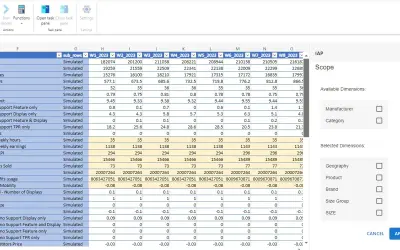
Fractal IAP is an Excel add-in that generates forecasts using advanced algorithms, trends, and seasonality factors.
Fractal Analytics, Inc.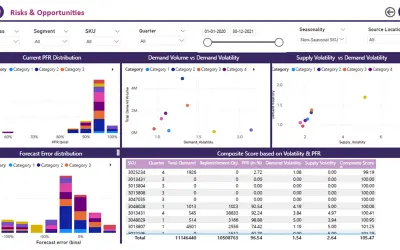
Fractal SafeStock optimizes multi-echelon inventory and stock deployment by simulating policies to evaluate safety stock levels.
Fractal Analytics Inc.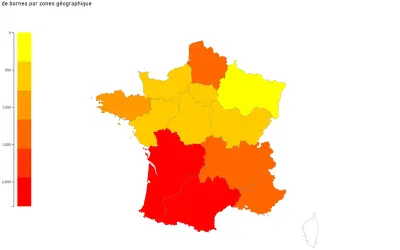
France map visual with four-level drilldown (region, department, district, city) that requires no geojson import.
Data Khi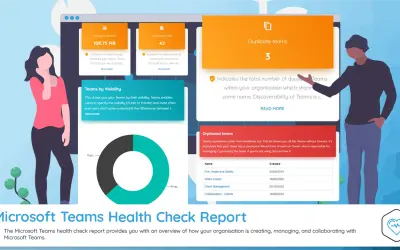
Generates a health check report for Microsoft Teams tenancies covering guest access, third-party apps, and document storage.
Konsolute
Freehand provides a visual whiteboard canvas for planning, brainstorming, and presenting directly inside Microsoft Teams.
InVisionApp Inc.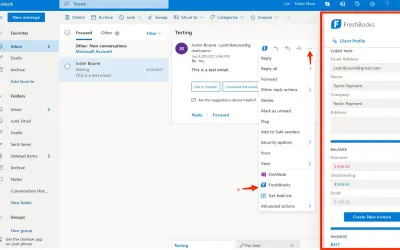
Creates, sends, and tracks client invoices directly within Outlook for FreshBooks subscribers, at no additional cost.
FreshBooks.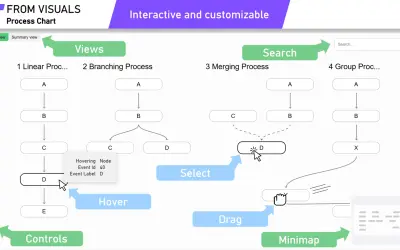
A Power BI visual that charts process-related data in Process and Summary views, with drill-through, search, and event grouping.
From Visuals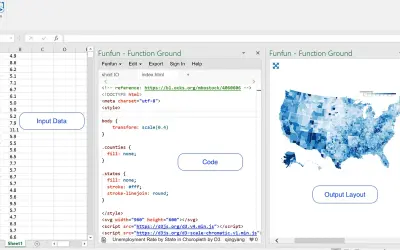
Excel add-in that runs Funfun platform functions for data visualization and machine learning, writing output back to Excel.
Matrix Lead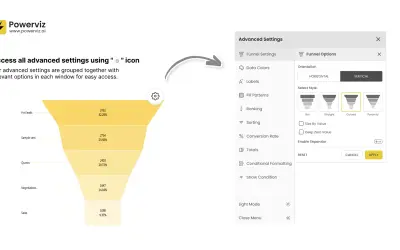
Funnel Chart by Powerviz visualizes data progression through process stages as a custom visual for Microsoft Power BI.
TRUVIZ INC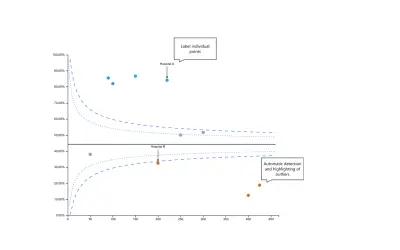
Builds no-code funnel plots for Power BI, covering proportions and ratios of counts, with export to PDF and PowerPoint.
Government of Western Australia - Department of Health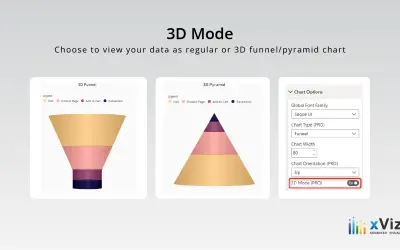
xViz Funnel/Pyramid Chart displays process stages and hierarchies with configurable 2D or 3D views for Power BI reports.
xViz LLC dba Lumel
Fuse Flow provides access to expert knowledge and learning content from Fuse for employees directly in Microsoft Teams.
Fuse Universal
FYN Layouts adds document formatting features such as subtotals, position numbers, and a WYSIWYG editor to Business Central.
Fynancy GmbH
Exports the documents in a GladtoLink filter, together with their custom fields and data, into an Excel spreadsheet.
GLADTOLINK.COM (ILLA DOCS S.L.)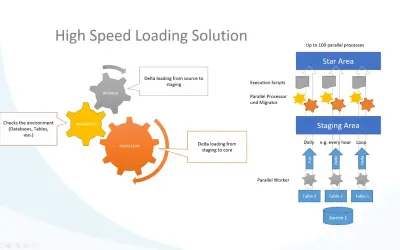
Builds a data warehouse on Microsoft SQL Server or Azure DB in two days, with near real-time processing and a Power BI dashboard.
GABO mbH & Co KG
Gaia Workspace provides desk and meeting room booking with attendance tracking and analytics inside Microsoft Teams.
GaiaDigits Inc.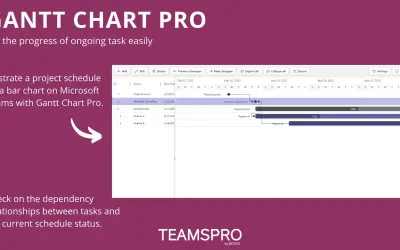
Gantt chart app for Microsoft Teams that lets users add tasks, set dependencies, allocate resources, and export to CSV or PDF.
Witivio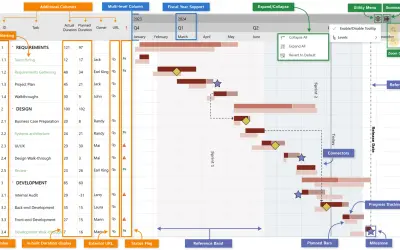
Gantt chart visual for Power BI that breaks projects down into tasks, subtasks, and milestones with dependency tracking.
xViz LLC dba Lumel