
Power Plot Visual by Akvelon
Creates visualizations from diverse chart types, combines multiple charts on one canvas, and adds custom annotations and tooltips.
AkvelonFreemium
France map visual with drilldown from region to department, district, and city.
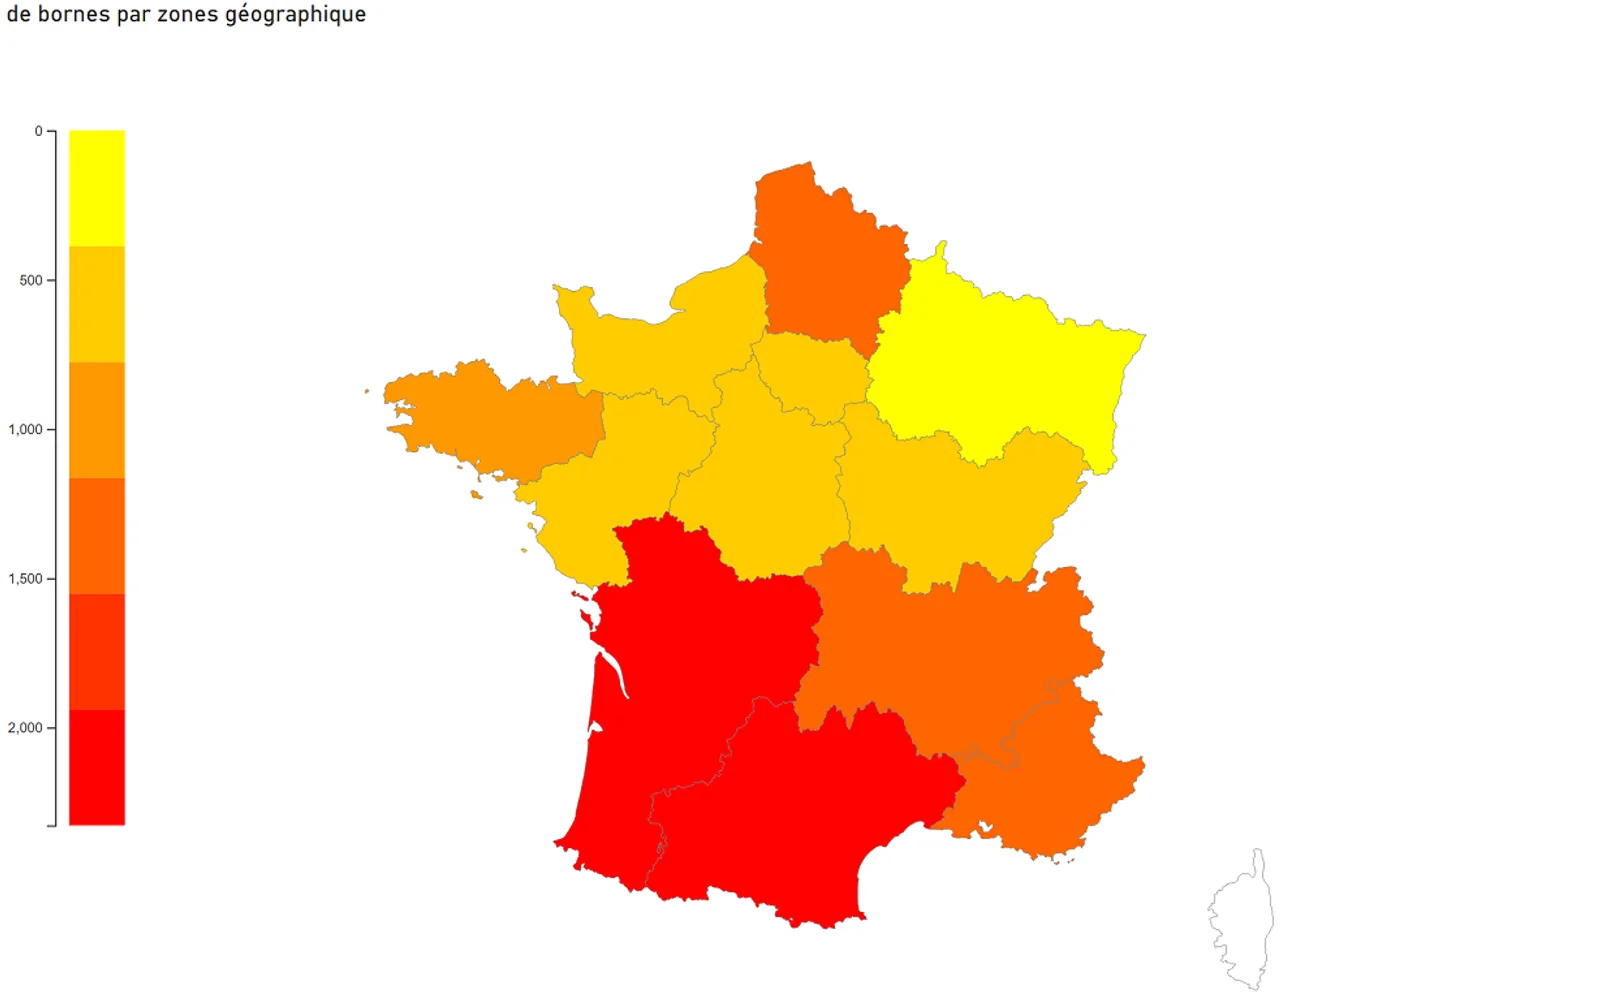
Displays a choropleth map of France with four drilldown levels: region, department, district, and city. Regions, departments, and districts can use names or INSEE codes. Cities require an INSEE code combining the department and city codes. A CSV dimension table is available with French regions, departments, districts, and cities.
Drills from region to department, district, and city.
Accepts names or INSEE codes for regions, departments, and districts.
Uses a combined department and city INSEE code for cities.
Displays geographic data on a choropleth map of France.
2,531 plugins in Analytics
Price distribution: 125 free, 147 freemium, 1,350 paid, 909 price not published
Creates visualizations from diverse chart types, combines multiple charts on one canvas, and adds custom annotations and tooltips.
Akvelon
Creates financial and business reports in Power BI with automatic variance calculations, P&L logic, and drill-down (s5, s6).
Zebra BI
COSMO Text Module provides extended text management with a WYSIWYG editor for Microsoft Dynamics 365 Business Central.
COSMO CONSULT
Discover the why behind your data.
Data Courage«horopleth map of France visual which allows you to drilldown on 4 levels of detail : region, department, district and city. There is no additional mapping or import of geojson to do to make it work. You can either use name or INSEE code for regions, departments and districts. Regarding cities, you have to use INSEE …»