ChartExpo™ for Excel
ChartExpo for Excel is a data visualization add-in that generates custom charts from spreadsheets using a three-click process.
polyvista.comPrice not published
Create customizable funnel plots in PowerPoint with point labels, conditional formatting, and PDF or PowerPoint export.
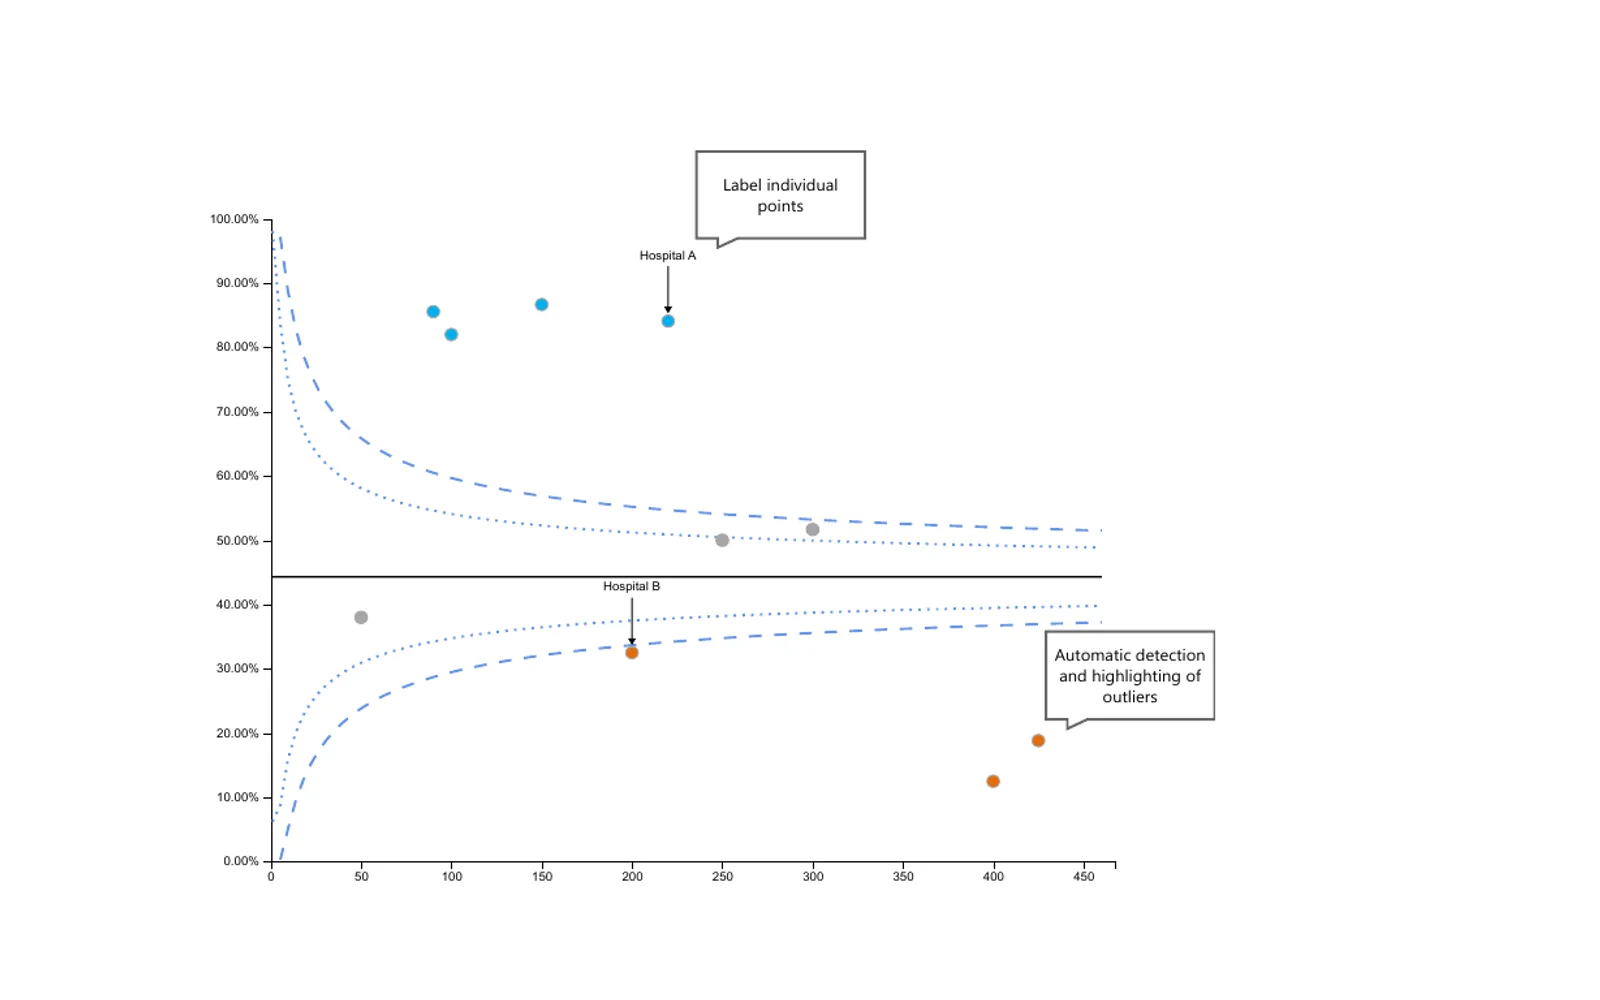
Creates funnel plots in PowerPoint with two or three clicks. The visual supports proportions, indirectly standardised ratios of counts, and ratios of counts. It allows plot customisation, point-specific conditional formatting, individual point labels, and export to PDF or PowerPoint.
Creates funnel plots for proportions.
Creates funnel plots for indirectly standardised ratios of counts.
Creates funnel plots for ratios of counts.
Customises the aesthetics of the plot.
Applies point-specific conditional formatting.
Exports charts to PDF and PowerPoint.
Labels individual points on charts.
Health analysts.
Funnel Charts has a paid pricing model, while ChartExpo™ for Excel, Personal dashboard by adenin, and OnBrandSlide Templates & Brand Kit for PowerPoint have unknown pricing models. Funnel Charts was updated on Sep 2025; ChartExpo™ for Excel was updated on Jan 2026, Personal dashboard by adenin on Nov 2023, and OnBrandSlide Templates & Brand Kit for PowerPoint on May 2026. All four listings use cloud deployment.
| Name | Pricing | Deployment | Updated |
|---|---|---|---|
| this plugin | Paid | Cloud | |
| ChartExpo™ for Excel | Price not published | Cloud | |
| Personal dashboard by adenin | Price not published | Cloud | |
| OnBrandSlide Templates & Brand Kit for PowerPoint | Price not published | Cloud |
156 plugins in PowerPoint · Analytics
Price distribution: 9 free, 6 freemium, 58 paid, 83 price not published
ChartExpo for Excel is a data visualization add-in that generates custom charts from spreadsheets using a three-click process.
polyvista.com
Personal dashboard by adenin aggregates live data from external apps into Adaptive Cards displayed on SharePoint intranet pages.
adenin TECHNOLOGIES Inc
PPT-Design provides slide templates, brand kit tools, icons, stock imagery, and productivity utilities directly inside PowerPoint.
PPT-DESIGN LTD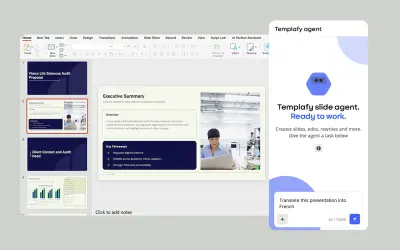
AI agent for PowerPoint that generates governed, on-brand slides from prompts using approved templates and business rules.
Templafy«Create Funnel Plots in Just Three Clicks! Unlock the power of your data with our custom visual, designed to create funnel plots as simply as possible. With just two or three clicks, you can generate insightful charts that help you identify variation. Why Choose Our Funnel Plot Visual? • User-Friendly: Our visual is …»