Optimus Hive Process & Task Miner Analyzer
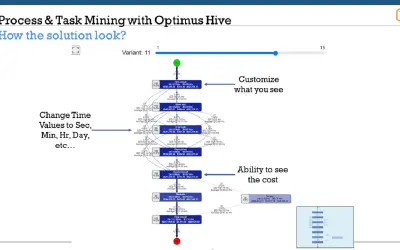
Converts activity records into graphical process flows for Optimus Hive to display variant statistics and path details.
Ai Transitioning LLCPaidCompare
1350 analytics apps for Microsoft 365
Converts activity records into graphical process flows for Optimus Hive to display variant statistics and path details.
Ai Transitioning LLC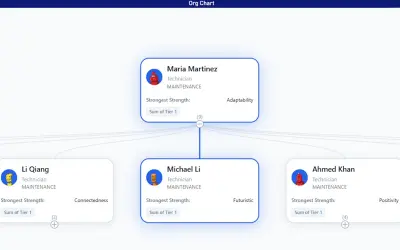
A custom visual for Power BI that transforms hierarchical employee data into an interactive organization chart with search.
Hoang Nguyen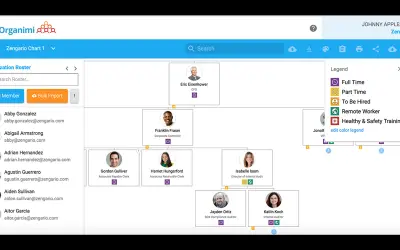
Organimi is purpose-built org chart software for creating, sharing, and printing organizational charts for your workplace.
Organimi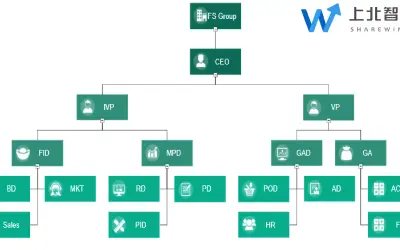
Generates dynamic, real-time organization charts for Sharewinfo, with one-click automatic layout and configurable styles.
北京上北智信科技有限公司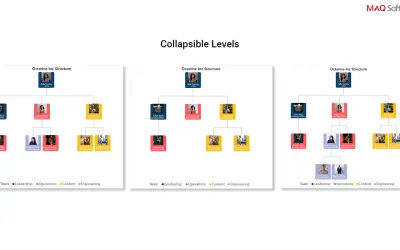
Organization Chart by MAQ Software depicts relationships and ranks in a structured tree format with images to identify personnel.
MAQ LLC
A cloud-based routing optimization suite for fleet dispatch, load building, and service planning across multiple industries.
ORTEC B.V.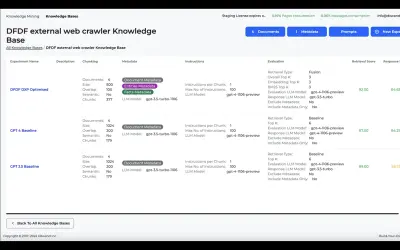
Build no-code conversational agents with RAG and multimodal support using ORXTRA - DXwand's Gen AI Agents Platform.
DXwand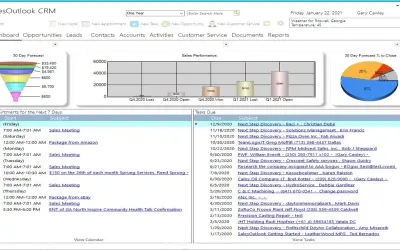
SalesOutlook CRM synchronizes data between Outlook and NetSuite, providing account, contact, lead, and opportunity management.
SalesOutlook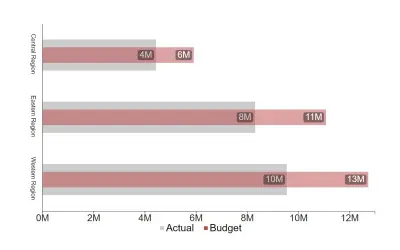
This horizontal bar chart is great for comparing two categories of data in a compact format by overlapping the bars.
Acorn Hill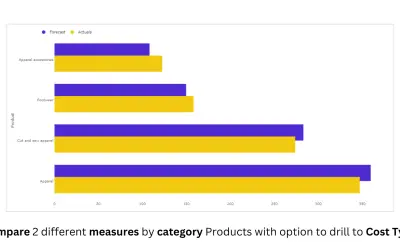
Overlapping Bar (Standard) creates overlay bar chart variations such as thermometer and lipstick charts for Microsoft Power BI.
PBIVizEdit.com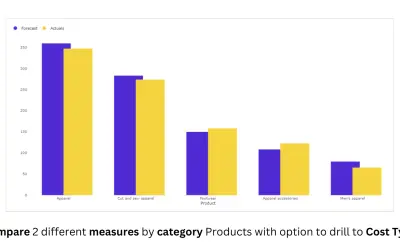
Overlapping Column (Standard) creates overlay column chart variations, including thermometer and lipstick styles, for Power BI.
PBIVizEdit.com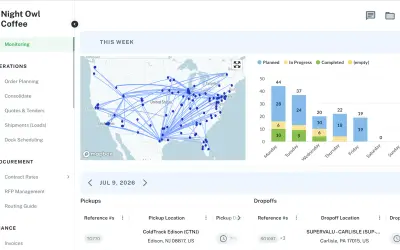
Owlery automates rate shopping, load building, tracking, and invoice auditing for Business Central and Dynamics 365.
Owlery, Inc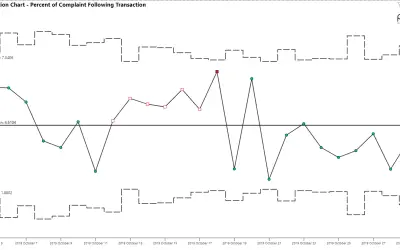
P-Chart plots proportions of nonconforming items across varying subgroup sizes within PI VIZpack™ for Power BI®.
PQ Systems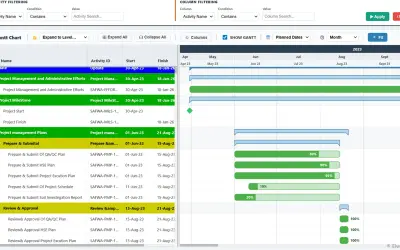
Visualizes project timelines and task hierarchies from Primavera P6 schedule data as an interactive Gantt chart in Power BI.
4Cs Global LLC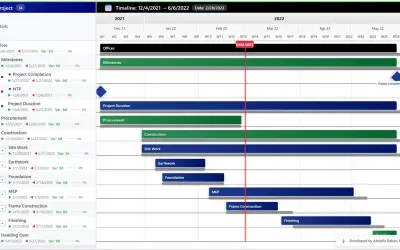
A Power BI custom visual providing five Oracle Primavera P6-style Gantt chart layouts for project management reporting.
Abdalla Dabes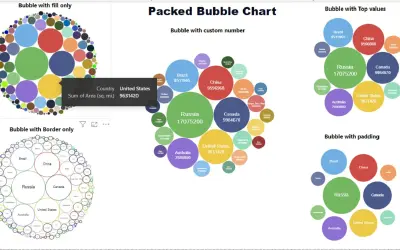
PackedBubbleChart displays data as sized, categorized bubbles with shape and tooltip options for Power BI custom visuals.
Qatar Financial Centre Regulatory Authority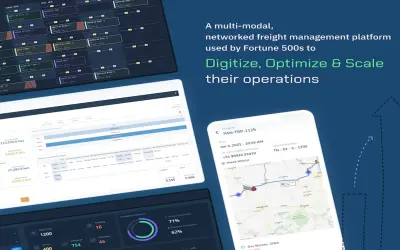
Pando TMS provides a freight automation platform covering transport and warehouse management for enterprise logistics operations.
Pandocorp Private Limited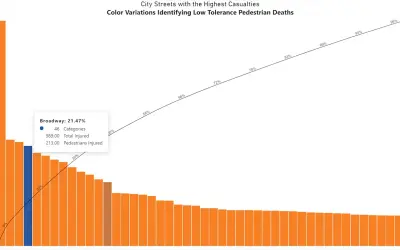
Pareto by sio2Graphs renders horizontal bar and cumulative line charts for category analysis within Microsoft Power BI.
sio2Graphs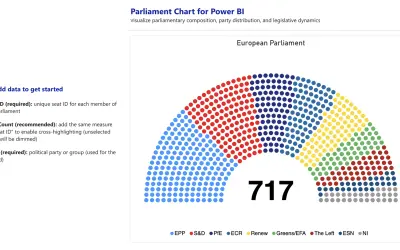
Displays political party compositions, majority thresholds, and coalitions in a hemicycle layout inside Power BI reports.
ChartPad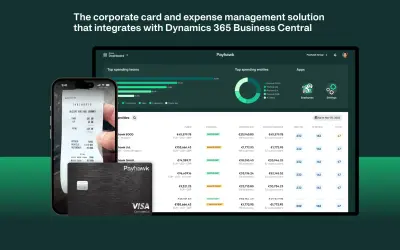
Payhawk offers corporate Visa cards, expense management, spend controls, and accounts payable for Dynamics 365 Business Central.
Payhawk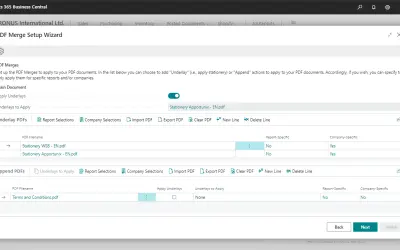
PDF Merge applies stationery underlays and appends pages to PDF documents produced in Microsoft Dynamics 365 Business Central.
Apportunix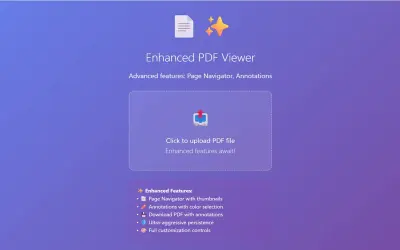
Power BI visual that displays PDF documents in reports and automatically retains files, page positions, zoom, and annotations.
Abdalla Dabes