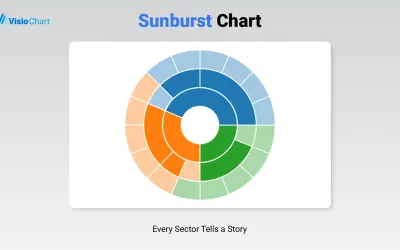
Sunburst Chart
Displays up to five levels of hierarchical data as proportional segments across concentric rings in Power BI reports.
VisioChartFreemium
Displays legislative seat arrangements, party groupings, majority levels, and coalitions in Power BI.
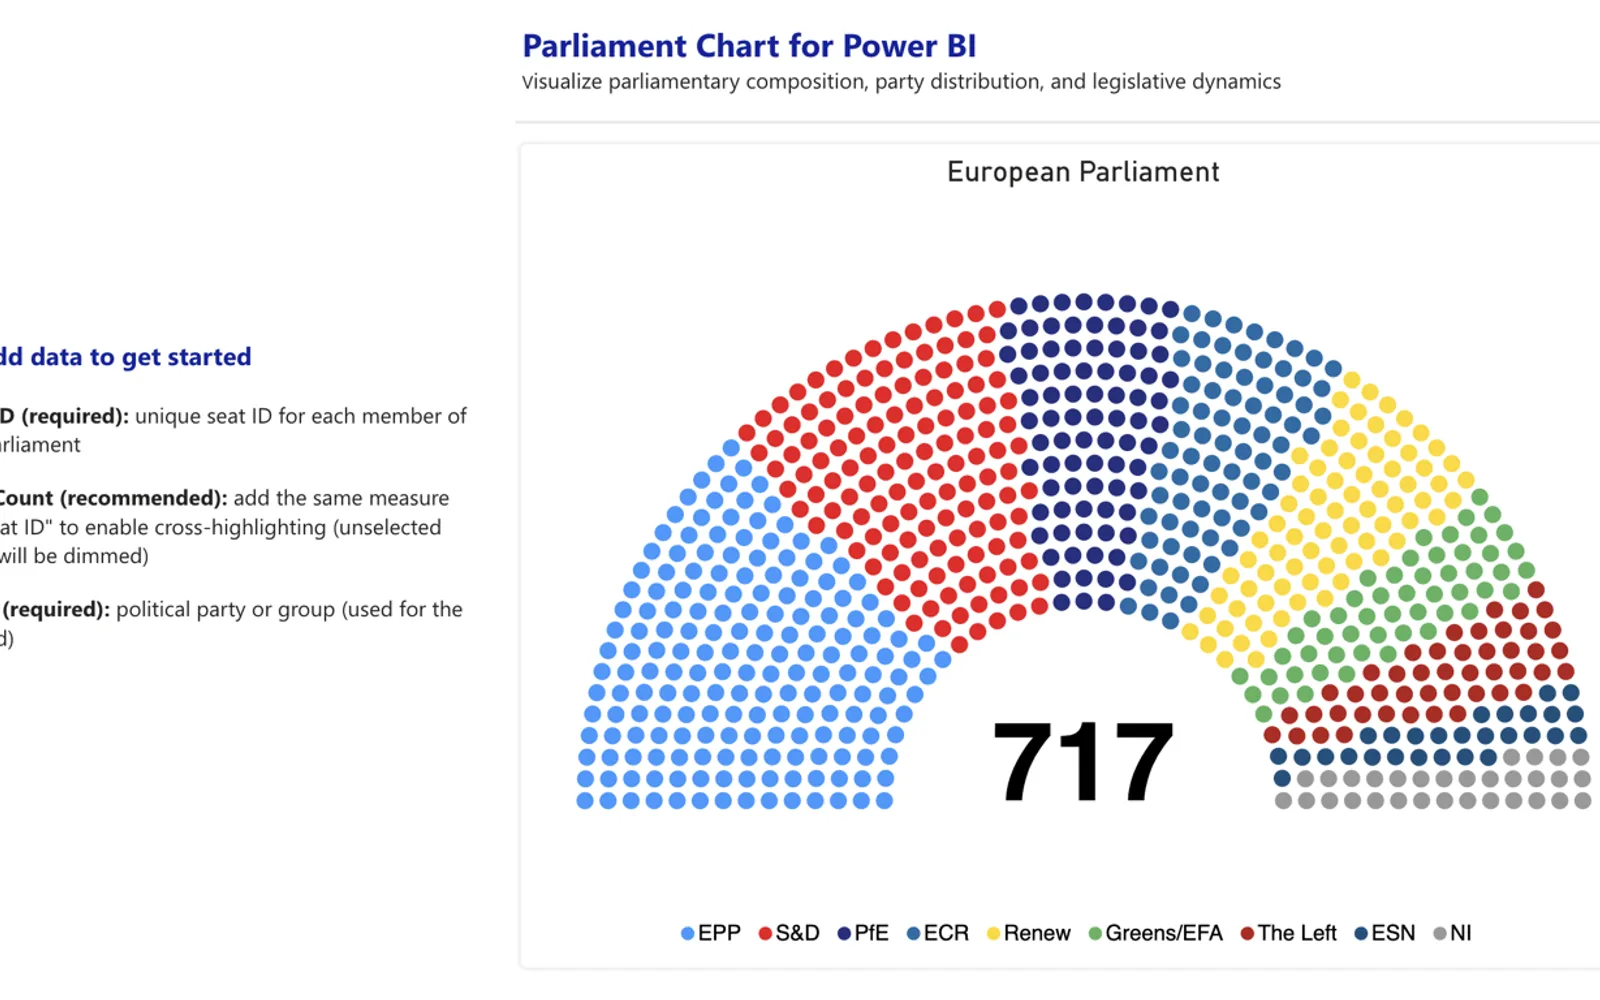
Parliament Chart represents parliaments, congresses, senates, councils, and boards with a semicircular seat arrangement in Power BI. It can emphasize selected parties or members through colors and group sequencing. The visual supports cross-filtering, multiple selections, report tooltips, appearance settings, legend positioning, and branding themes.
Arranges seats in a curved layout for legislative chambers and other assemblies.
Shows majority levels and coalition groupings.
Applies custom colors and ordering to selected members or parties.
Provides cross-filtering, multiple-selection highlighting, and configurable tooltips in Power BI.
Allows changes to visual styling, legend placement, and institutional branding themes.
The vendor names government and public-sector teams, media and journalism teams, think tanks, policy researchers, and corporate or institutional governance teams.
Parliament Chart uses a paid pricing model, while Sunburst Chart uses a freemium model. Both listings use cloud deployment. Parliament Chart lists an update date of Aug 2026, while Sunburst Chart lists Dec 2025.
| Name | Pricing | Deployment | Updated |
|---|---|---|---|
| this plugin | Paid | Cloud | |
| Sunburst Chart | Freemium | Cloud |
910 plugins in Power BI · Analytics
Price distribution: 80 free, 121 freemium, 504 paid, 205 price not published
Displays up to five levels of hierarchical data as proportional segments across concentric rings in Power BI reports.
VisioChart
Creates visualizations from diverse chart types, combines multiple charts on one canvas, and adds custom annotations and tooltips.
Akvelon
Creates financial and business reports in Power BI with automatic variance calculations, P&L logic, and drill-down (s5, s6).
Zebra BI
AI analysis app for Dynamics 365 Business Central that provides customer KPIs, churn probability, and customer grouping.
Data Courage«The Parliament & Hemicycle Chart for Power BI is a dedicated custom visual designed to render legislative bodies and assemblies. Whether visualizing a parliament, congress, senate, municipal council, or board of directors, this visual provides an intuitive, publication-ready representation of political party …»