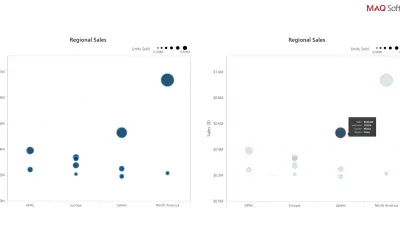
Dot Plot by MAQ Software
Dot Plot by MAQ Software displays categorized data points on an X/Y axis as a custom visual for Power BI.
MAQ LLCPaidCompare
1350 analytics apps for Microsoft 365
Dot Plot by MAQ Software displays categorized data points on an X/Y axis as a custom visual for Power BI.
MAQ LLC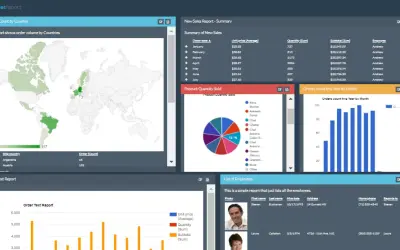
An SSRS alternative that embeds reporting and dashboards in web applications, with filters, drilldowns, charts, and a scheduler.
Dot Report, Inc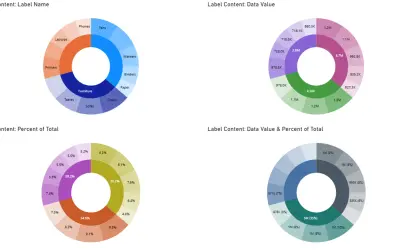
Power BI visual that shows primary categories and their subcategories as two concentric donut charts with interactive tooltips.
NeenOpal Inc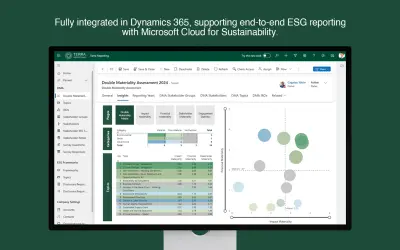
Terra Reporting's DMA module digitizes double materiality assessments for Microsoft Cloud for Sustainability.
Terra Reporting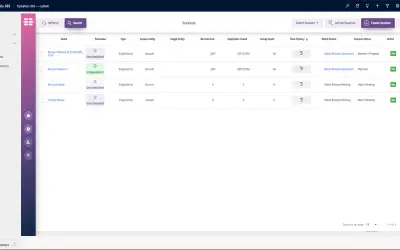
Identifies and merges duplicate records across Dynamics 365 entities, producing a single Golden Record through fuzzy search.
DQ Global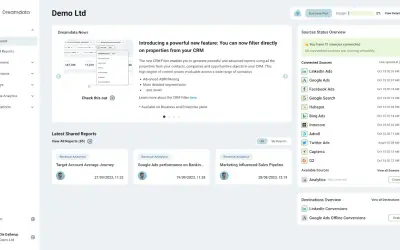
Combines Microsoft Dynamics CRM data with other customer data to map the B2B customer journey and attribute revenue.
Dreamdata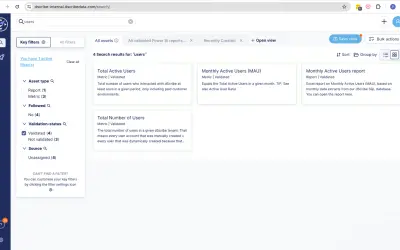
dScribe data compass embeds definitions and guidance inside BI dashboards and browser-based enterprise applications.
dScribe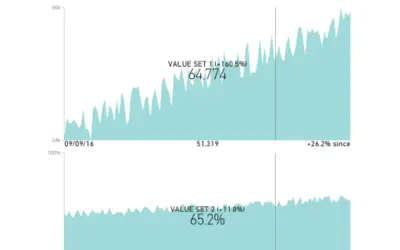
Dual KPI visualizes key performance indicators as line or area charts with historical values and hover-based change highlights.
Microsoft Corporation
Enables a second unit of measure for pricing, discounting, and sales and purchase functions in Dynamics 365 Business Central.
EOS Solutions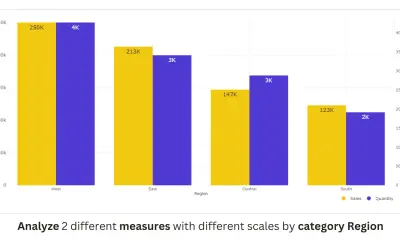
PBIVizEdit's Dual Y-Axis Column Chart (Standard) creates overlay column chart variations for Microsoft Power BI platforms.
PBIVizEdit.com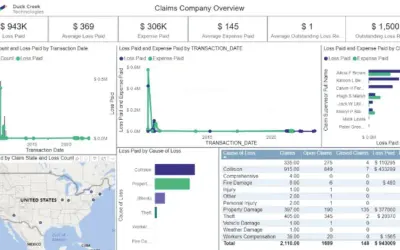
Helps insurers make underwriting, pricing, claims, and marketing decisions from Duck Creek Policy, Billing, and Claims data.
Duck Creek Technologies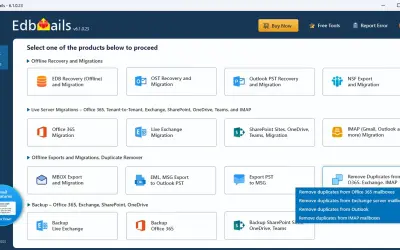
EdbMails Duplicate Remover detects and removes duplicate emails from Office 365, Exchange, Outlook, and IMAP accounts.
SHIFTTOCLOUD INC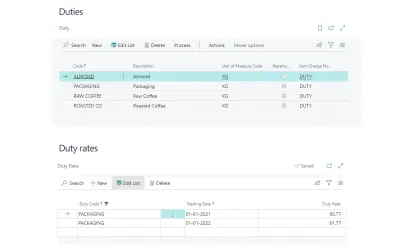
Automates excise duty calculation and authority reporting for items traded in Microsoft Dynamics 365 Business Central.
Abakion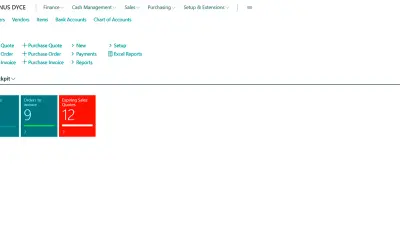
A customizable dashboard consolidating KPIs, real-time data, and quick navigation for Microsoft Dynamics 365 Business Central.
Singhammer IT Consulting AG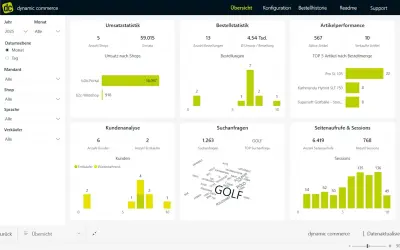
Power BI dashboard for the dynamic commerce platform that reports on shop sales, product performance, orders, and customers.
dc AG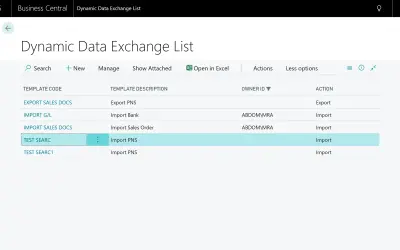
Configure integrations and data imports in Microsoft Dynamics 365 Business Central entirely through data settings.
Abakion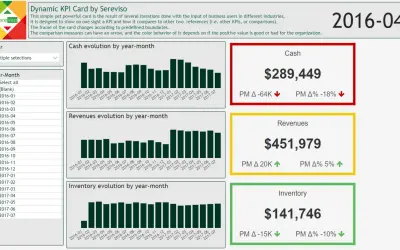
Dynamic KPI Card by Sereviso displays a KPI against two references with boundary-based frame changes for enterprise dashboards.
Entech SPA AG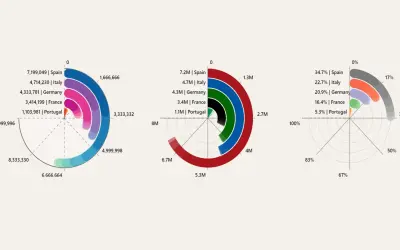
A radial bar chart visualization with drill-down, global or individual targets by category, and multiple configuration options.
JTA The Data Scientists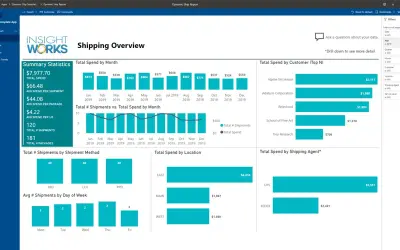
Provides real-time shipping metrics and spend analysis for users of Dynamic Ship on Dynamics 365 Business Central.
Insight Works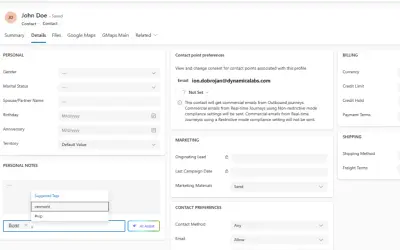
Dynamica Tagging enables tag-based categorization, AI-suggested hashtags, and analytics for records in Dynamics 365 environments.
Dynamica Labs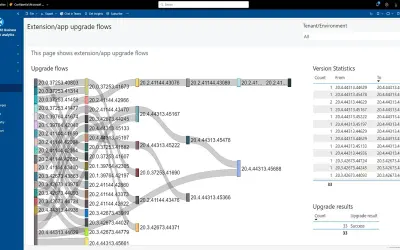
Provides a Power BI dashboard to visualize Dynamics 365 Business Central app usage, errors, and performance metrics.
Microsoft