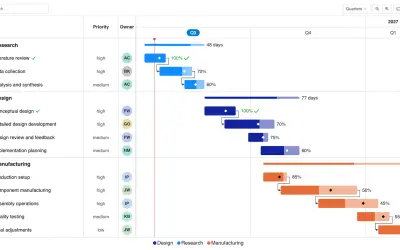
Gantt Chart
Gantt Chart is a project management visual for Microsoft Power BI that tracks schedules, milestones, and resource workloads.
ChartPadFree
Combines radial and bar charts for Power BI data.
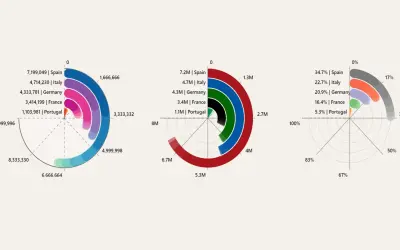
Combines bar and radial chart formats in a Power BI visual. It provides multiple configurations, drill-down for viewing information in detail, and multiple field choices during drill-down. Targets can be defined globally or by category for comparison with data.
Drill down into information to view it in detail.
Define global or individual targets by category for comparison with data.
Choose between multiple fields when drilling down.
2,531 plugins in Power BI · Analytics
Price distribution: 125 free, 147 freemium, 1,350 paid, 909 price not published
Gantt Chart is a project management visual for Microsoft Power BI that tracks schedules, milestones, and resource workloads.
ChartPad
Creates visualizations from diverse chart types, combines multiple charts on one canvas, and adds custom annotations and tooltips.
Akvelon
Creates financial and business reports in Power BI with automatic variance calculations, P&L logic, and drill-down (s5, s6).
Zebra BI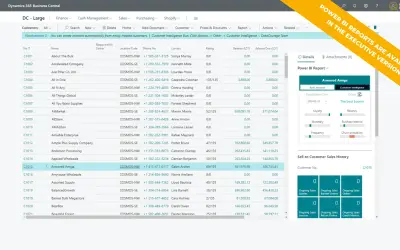
AI analysis app for Dynamics 365 Business Central that provides customer KPIs, churn probability, and customer grouping.
Data Courage«The Data Scientists combines two of the most effective and common charts in the data visualization field — the bar chart and the radial chart. With multiple configurations available, the visual will allow you to navigate and quickly understand your data. With a vast range of functionalities and customizing options …»