
Power Plot Visual by Akvelon
Creates visualizations from diverse chart types, combines multiple charts on one canvas, and adds custom annotations and tooltips.
AkvelonFreemium
Displays a KPI with two comparison measures in a dynamic card.
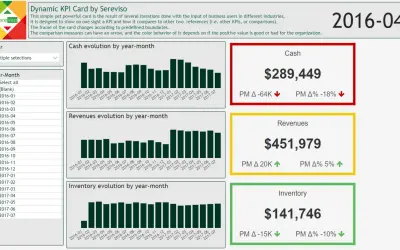
Presents one KPI together with two comparison references, which may be other KPIs or comparison values. The card frame changes when values cross predefined boundaries. Comparison measures may include arrows whose colors depend on whether a positive value is favorable or unfavorable for the organization.
Displays a KPI in a card.
Shows two references alongside the KPI, including other KPIs or comparison values.
Changes the card frame according to predefined boundaries.
Uses arrow colors based on whether a positive value is favorable or unfavorable.
Business users in different industries.
2,531 plugins in Analytics
Price distribution: 125 free, 147 freemium, 1,350 paid, 909 price not published
Creates visualizations from diverse chart types, combines multiple charts on one canvas, and adds custom annotations and tooltips.
Akvelon
Creates financial and business reports in Power BI with automatic variance calculations, P&L logic, and drill-down (s5, s6).
Zebra BI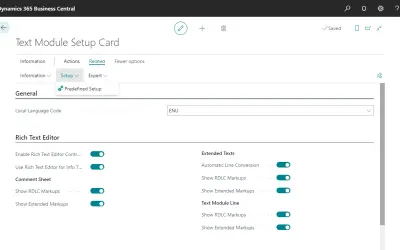
COSMO Text Module provides extended text management with a WYSIWYG editor for Microsoft Dynamics 365 Business Central.
COSMO CONSULT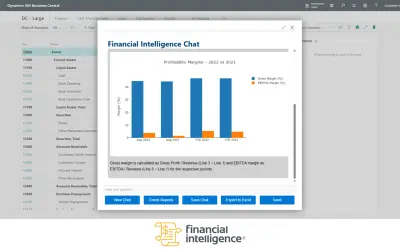
Discover the why behind your data.
Data Courage«This simple yet powerful card is the result of several iterations done with the input of business users in different industries. It is designed to show on one sight a KPI and how it compares to the other two references (i.e. other KPIs, or comparisons). The frame of the card changes according to predefined boundaries …»