Innofalls Charts
Power BI visual for building waterfall and bar charts through interactive navigation, drill downs, and dynamic comparisons.
Innofalls GmbHFreemium
Build configurable waterfall charts in Power BI for financial reporting, variance analysis, and management dashboards.
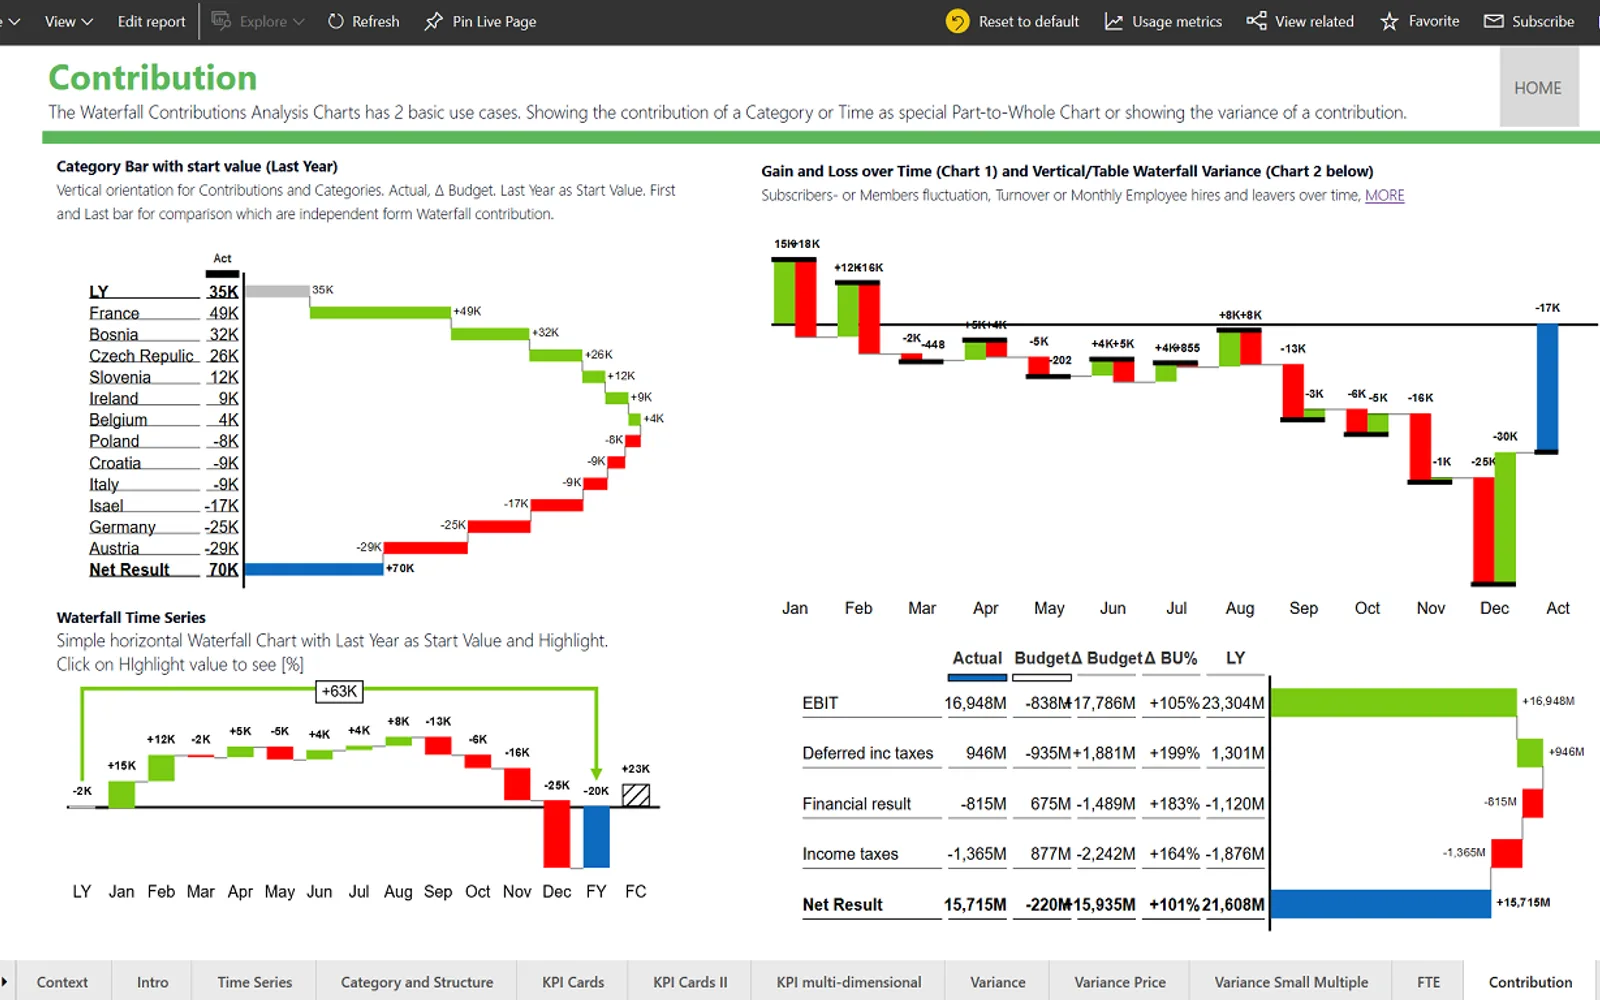
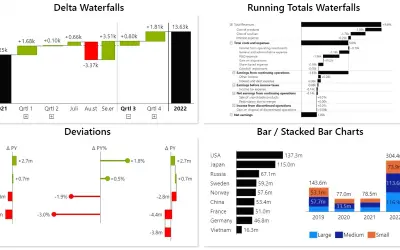
Ultimate Waterfall Chart adds waterfall visuals to Power BI in horizontal or vertical layouts. It displays contributions, subtotals, totals, starting amounts, and deviations. The paid version adds color controls for these elements and removes the watermark. The certified visual also supports PowerPoint export and Power BI report page subscriptions.
The visual provides horizontal and vertical waterfall chart layouts.
Charts can include contributions, subtotals, totals, starting amounts, and deviations.
Paid licenses provide separate color settings for the supported waterfall elements.
The paid version removes the visual watermark.
The certified visual can be exported to PowerPoint.
The visual supports subscriptions for Power BI report pages.
Ultimate Waterfall uses a paid pricing model and cloud deployment. Innofalls Charts and Bullet Chart - xViz are freemium and cloud-deployed, while Zebra BI Tables for Office has an unknown pricing model and Tree is paid; all are cloud-deployed. Ultimate Waterfall was updated on Aug 2026, compared with Dec 2025 for Innofalls Charts and Bullet Chart - xViz, Mar 2023 for Zebra BI Tables for Office, and Sep 2025 for Tree.
| Name | Pricing | Deployment | Updated |
|---|---|---|---|
| this plugin | Paid | Cloud | |
| Innofalls Charts | Freemium | Cloud | |
| Bullet Chart - xViz | Freemium | Cloud | |
| Zebra BI Tables for Office | Not in catalog | ||
| Tree | Paid | Cloud | |
744 plugins in Power BI · Analytics
Price distribution: 74 free, 110 freemium, 451 paid, 109 price not published
Power BI visual for building waterfall and bar charts through interactive navigation, drill downs, and dynamic comparisons.
Innofalls GmbH
Power BI visual for comparing actuals against targets, with IBCS-certified bullet chart templates and comparison bands.
xViz LLC dba Lumel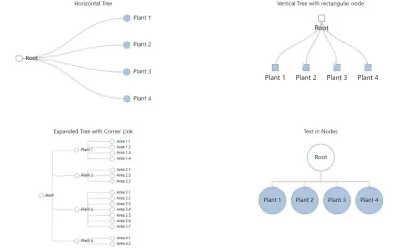
Tree for Power BI offers tree structure navigation with options for orientation, labels, node shape, and conditional formatting.
CK Corporation
Gantt Chart is a project management visual for Microsoft Power BI that tracks schedules, milestones, and resource workloads.
ChartPad«Ultimate Waterfall Chart for Power BI is a certified custom visual designed for professional financial reporting, management dashboards, variance analysis, and IBCS®-style business reporting. Create clear and insightful waterfall charts with both horizontal and vertical chart orientation, flexible formatting options …»