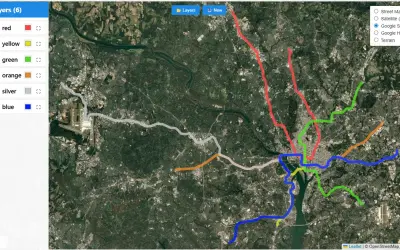
kml-kmz-visual
KML/KMZ Viewer renders points, lines, and polygons from KML and KMZ files on interactive maps within Power BI reports.
Abdalla DabesPaid
Visualizes logistics, distribution, and process flows in Power BI as interconnected metro-style maps.
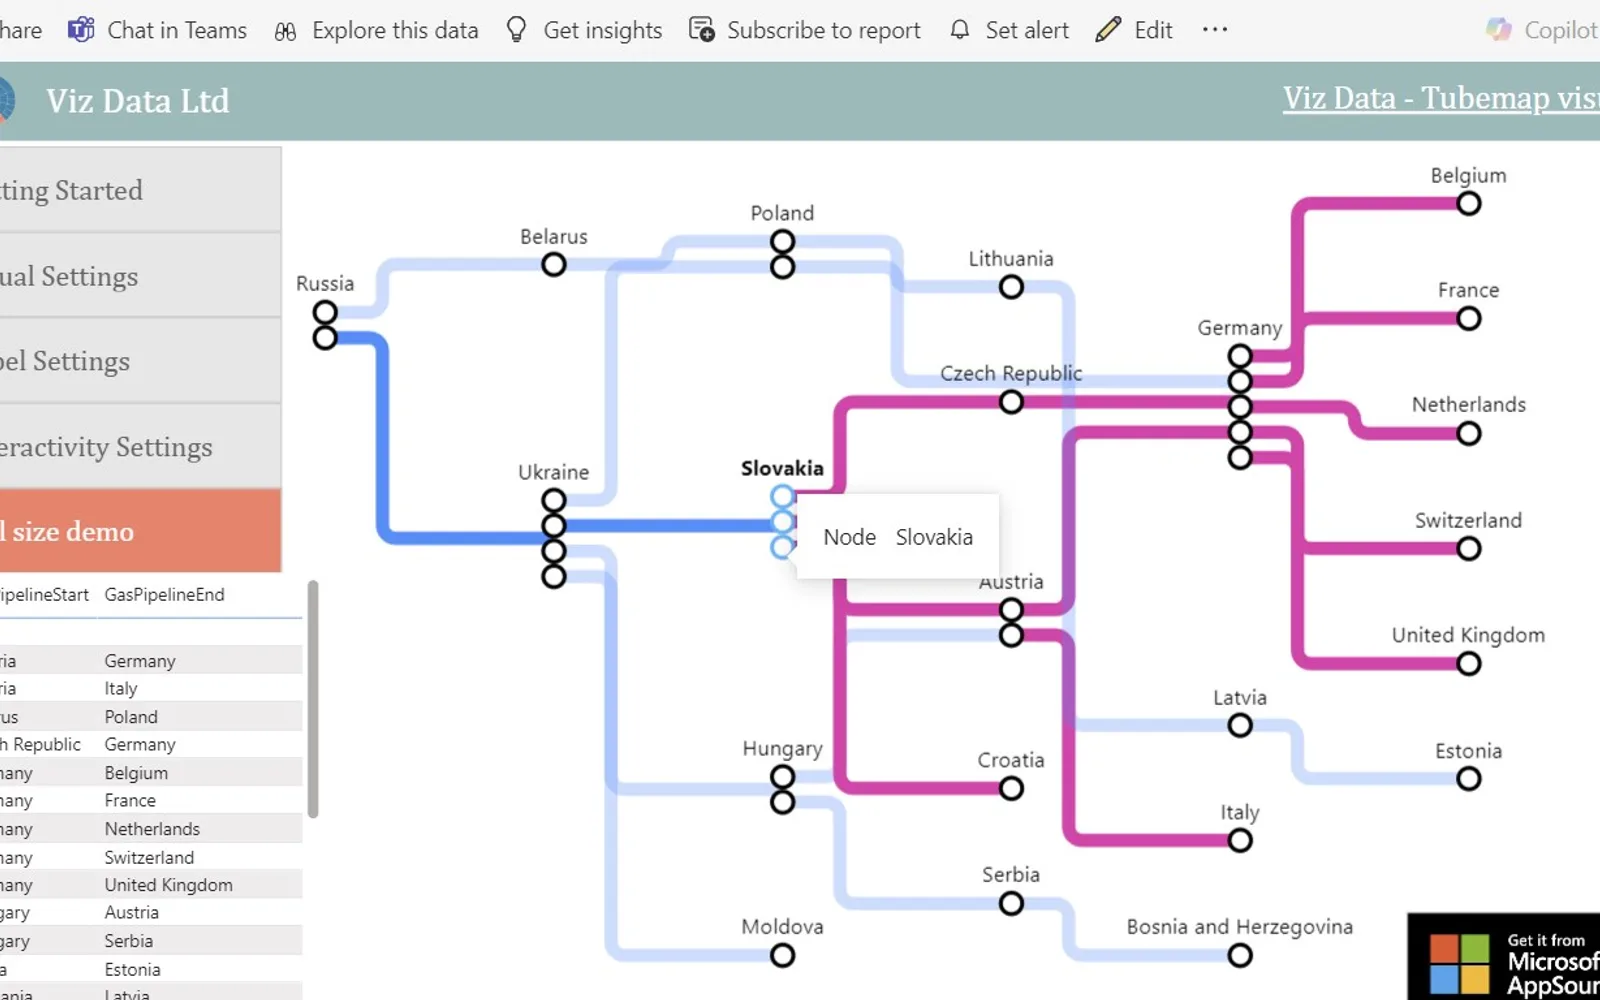
Metro Map converts pairs of start and end nodes into a map of connected nodes and paths in Power BI. It represents converging paths in logistics routes, transport networks, production processes, and stage gates. Hovering over or selecting a node highlights its dependencies and connected paths. The visual supports adjustments for line thickness, node size, colors, hover effects, and label positioning.
Transforms start and end data into an interconnected map.
Hovering over or selecting a node reveals its dependencies and connected paths.
Adjusts line thickness, node size, and colors.
Controls node hover effects and label positioning relative to nodes.
Skips license checks where user identity cannot be verified, including Publish to Web.
Metro Map is free and cloud-deployed, while KML/KMZ Visual, CoreIMS, Smart Grid-Map, and Drill Down Map PRO (Filter) by ZoomCharts are paid or freemium and cloud-deployed. Metro Map was updated on Dec 2025, compared with KML/KMZ Visual in Feb 2026, CoreIMS in Jan 2026, Smart Grid-Map in Dec 2025, and Drill Down Map PRO (Filter) by ZoomCharts in Aug 2026. The listing describes Metro Map as a flow visual for nodes, paths, logistics, distribution, and process flows; no corresponding capabilities are provided for the alternatives.
| Name | Pricing | Deployment | Updated |
|---|---|---|---|
| this plugin | Free | Cloud | |
| CoreIMS | Paid | Cloud | |
| Smart Grid-Map | Freemium | Cloud | |
| Drill Down Map PRO (Filter) by ZoomCharts | Freemium | Cloud |
744 plugins in Power BI · Analytics
Price distribution: 74 free, 110 freemium, 451 paid, 109 price not published
KML/KMZ Viewer renders points, lines, and polygons from KML and KMZ files on interactive maps within Power BI reports.
Abdalla Dabes
CoreIMS tracks inventory in real time across an organization's warehouses, covering receiving, shipping, and storage operations.
CorePartners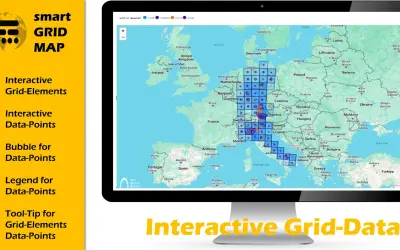
Smart Grid-Map is a custom Power BI visual for visualizing and analyzing grid and raster data with interactive polygons.
The Green Bridge GmbH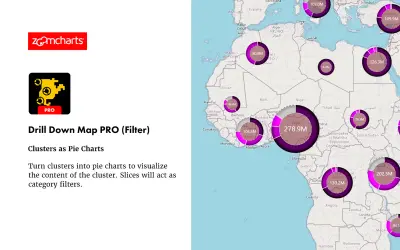
Drill Down Map PRO (Filter) by ZoomCharts visualizes and filters location data on interactive maps for Power BI Desktop reports.
ZoomCharts«Visualize logistics, distribution, and process flows with Metro Map Metro Map is a unique way to visualize flow data, perfect for showcasing supply chains, transport networks, production processes, and stage gates. Unlike force-directed graphs, Metro Map allows for convergence of paths, better representing real world …»