
Gantt Chart
Gantt Chart is a project management visual for Microsoft Power BI that tracks schedules, milestones, and resource workloads.
ChartPadFree
KPI card visual for Power BI with row, column, and matrix layouts across two dimensions.
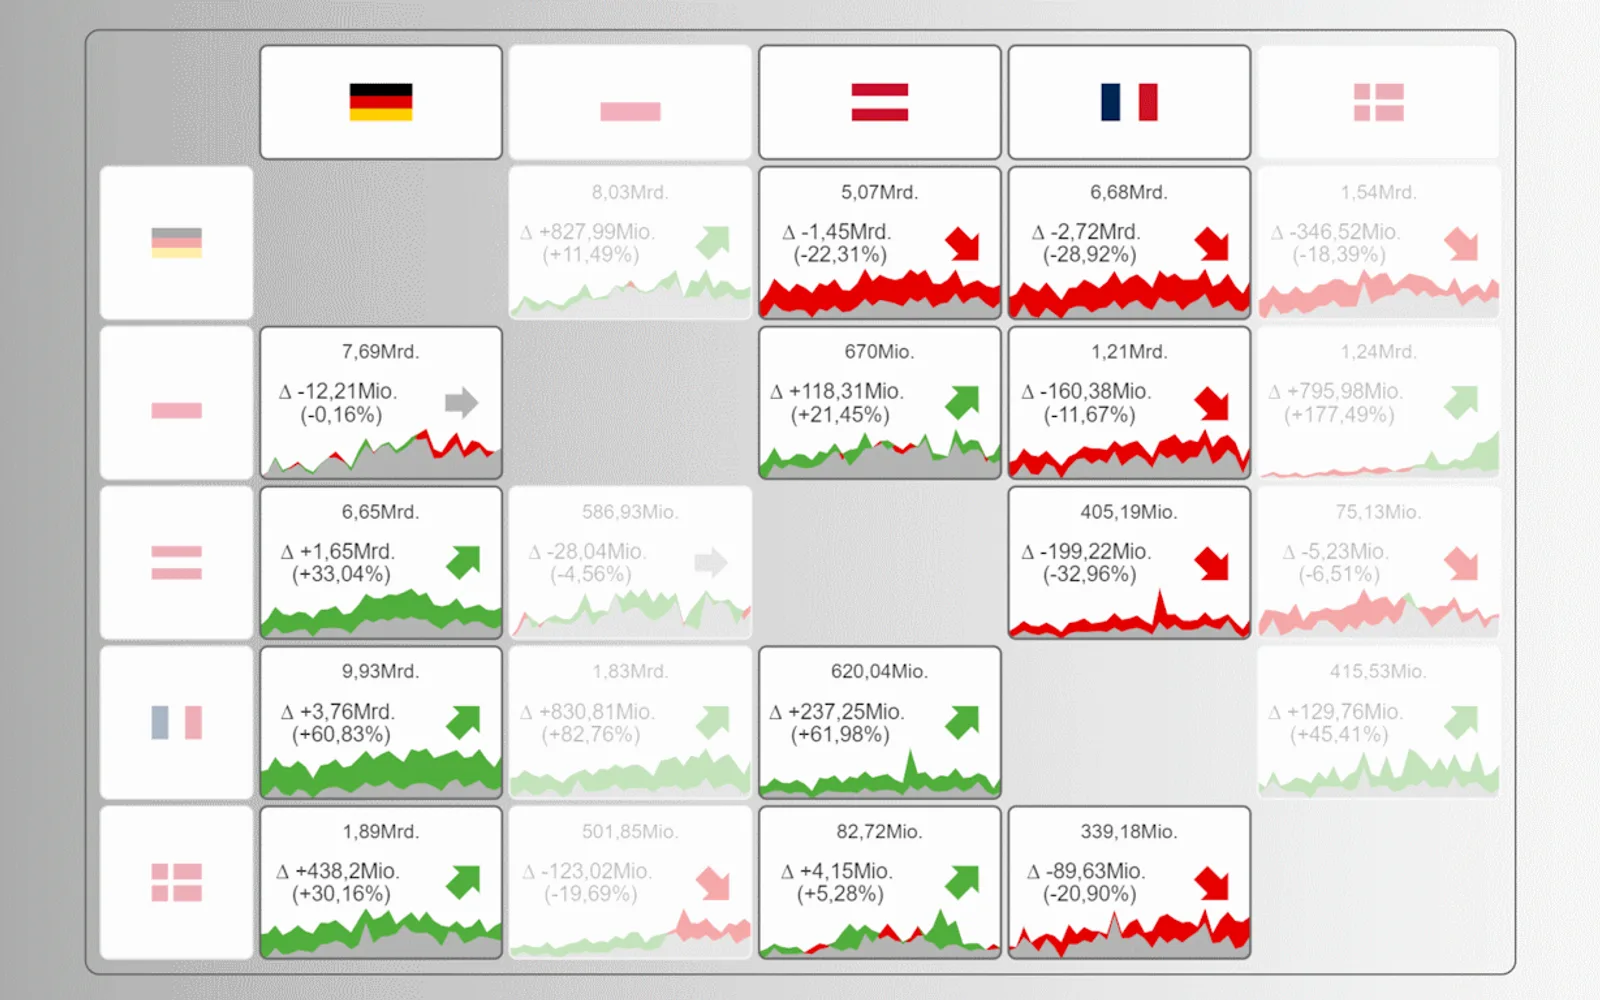
KPI Matrix displays multiple KPI cards in row, column, or matrix layouts in Power BI. Each card can show a measure with an optional target or comparison measure and an indicator. Mini charts display current or historical trends, while drill functionality controls detail. Conditional backgrounds can create heatmaps or show actual and target performance. Cards, rows, columns, and headers support interactive filtering or highlighting.
Displays KPI cards in row, column, or matrix layouts.
Provides more than 10 indicator styles with options for color, opacity, and shape.
Includes drillable line and indicative area mini charts for current or historical trends.
Supports conditional background formatting for heatmaps and actual or target performance.
Allows selection of individual cards, rows, or columns for filtering or highlighting.
Supports text or image row and column headers, with an option to place header content on cards.
Supports maximum card height and width constraints and automatic text wrapping for longer labels.
2,531 plugins in Power BI · Analytics
Price distribution: 125 free, 147 freemium, 1,350 paid, 909 price not published
Gantt Chart is a project management visual for Microsoft Power BI that tracks schedules, milestones, and resource workloads.
ChartPad
Creates visualizations from diverse chart types, combines multiple charts on one canvas, and adds custom annotations and tooltips.
Akvelon
Creates financial and business reports in Power BI with automatic variance calculations, P&L logic, and drill-down (s5, s6).
Zebra BI
AI analysis app for Dynamics 365 Business Central that provides customer KPIs, churn probability, and customer grouping.
Data Courage«KPI Matrix is a versatile and dynamic KPI card visual that combines classic KPI cards with the flexibility of a matrix layout. It enables you to visualize the relationship between two dimensions in a way no other visual can. Create and format multiple KPI cards effortlessly in a row, column, or matrix layout. The …»