Arc Diagram
Places nodes on a single axis and connects related pairs with arcs whose size can reflect a numeric measure of strength.
VisioChartFreemiumCompare
10 apps
Places nodes on a single axis and connects related pairs with arcs whose size can reflect a numeric measure of strength.
VisioChart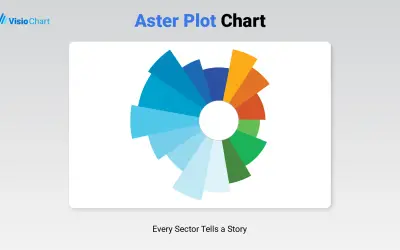
Visualizes categorical data in Power BI using two measures at once, with one shown by angle and the other by radius.
VisioChart
Bubble Diagram by VisioChart displays quantitative data as proportional bubble sizes for Microsoft Power BI reports.
VisioChart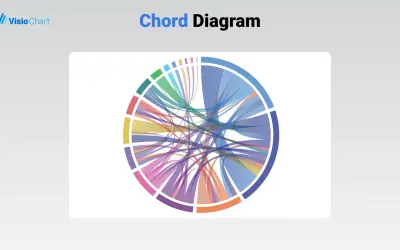
The Chord Diagram by VisioChart depicts data relationships as chords on a circular layout for Microsoft Power BI.
VisioChart
Non-Ribbon Chord Diagram by VisioChart visualizes interconnections between nodes in a circular layout for Microsoft Power BI.
VisioChart
Creates Sankey diagrams with up to 12 levels in Microsoft Power BI, with customizable nodes, flows, colors, and text.
VisioChart
Creates Sankey diagrams in Microsoft Excel and PowerPoint, with adjustable nodes, flows, statistics, text, and colors.
VisioChart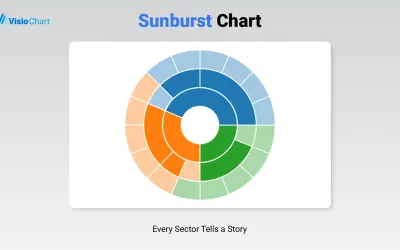
Displays up to five levels of hierarchical data as proportional segments across concentric rings in Power BI reports.
VisioChart