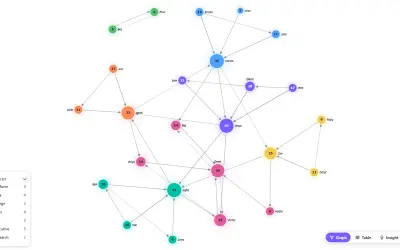
Zentrix Network Graph
Zentrix Network Graph renders deterministic node-edge layouts inside Power BI with cross-filtering and graph analytics.
Zentrix StudioFree
Visualizes relationships and flows between data points in a circular diagram inside Microsoft Power BI.
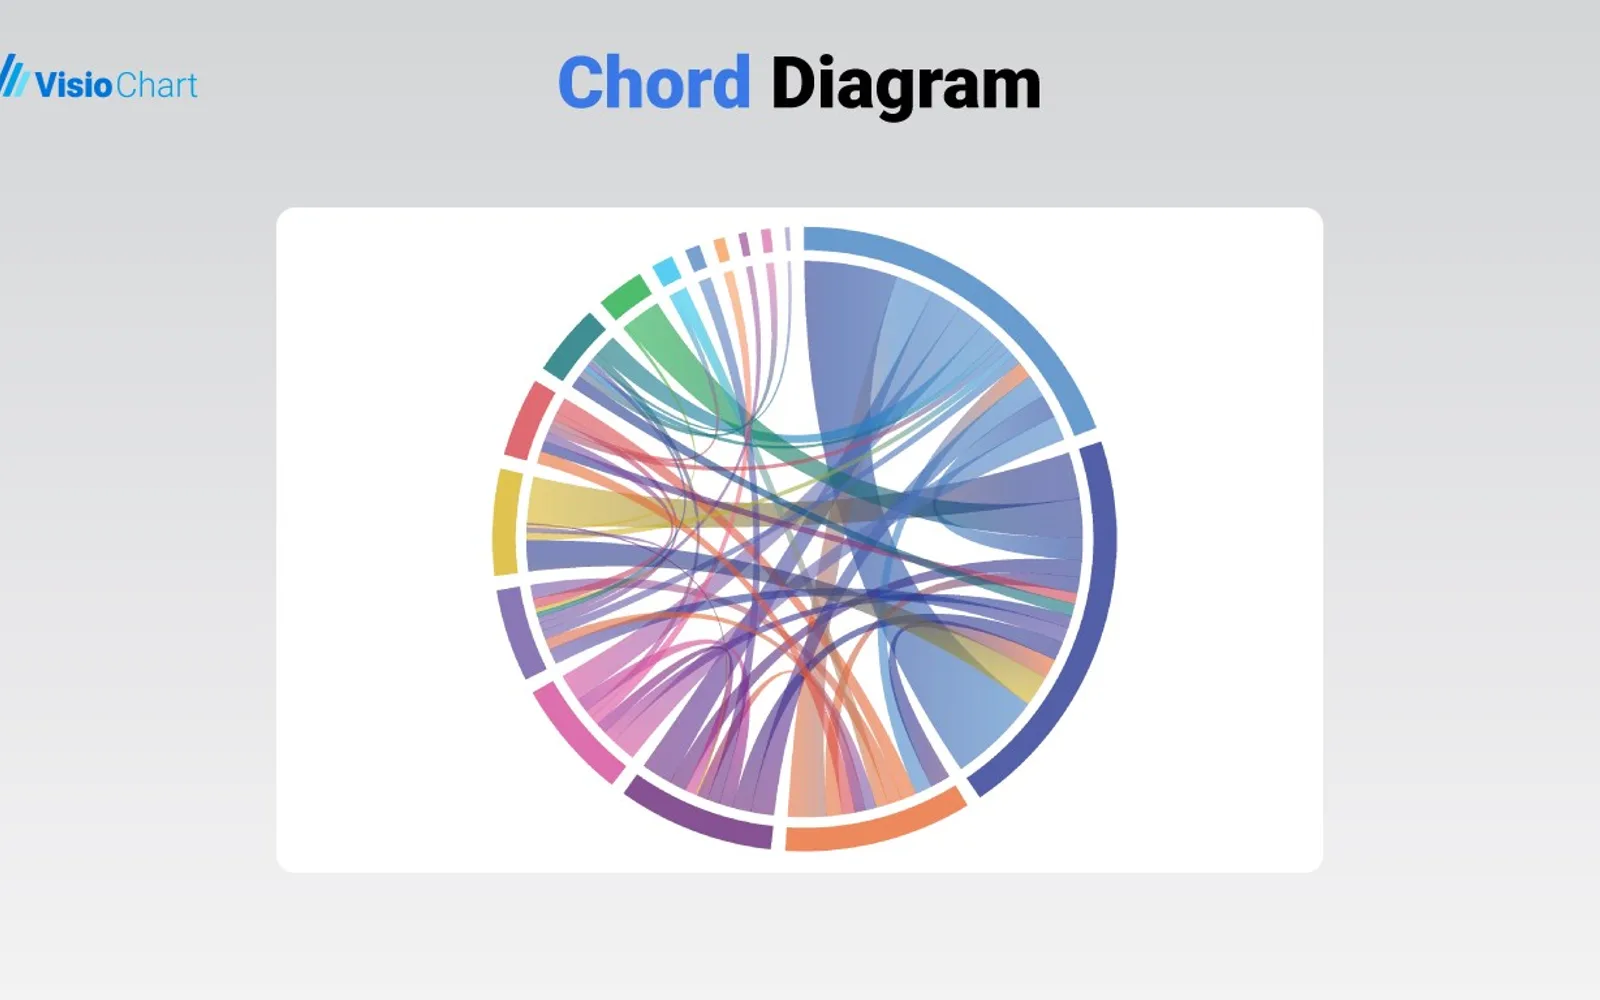
The Chord Diagram for Microsoft Power BI places data points around a circle and displays their relationships as chords or links. Chords can use solid, source-node, target-node, or gradient colors, with thickness representing relationship magnitude. Nodes can have assigned colors, labels, annotations, and tooltips. Links can be bidirectional or unidirectional.
Places data points around a circle and displays relationships between them as chords.
Displays links using solid color, source-node color, target-node color, or a gradient between source and target colors.
Uses chord thickness to represent the magnitude or strength of a relationship.
Assigns different colors to nodes to represent categories, groups, or values.
Displays additional information about a node or chord when users hover over it.
Adds labels to identify nodes and annotations to provide explanations or highlight points.
Supports bidirectional connections and unidirectional connections.
Chord Diagram is free and cloud deployed, as is Zentrix Network Graph, while Drill Down Network PRO (Pin) by ZoomCharts, Funnel/Pyramid Chart - xViz, and Wordlit are freemium, freemium, and paid respectively. Chord Diagram was updated on Dec 2025, compared with Aug 2026 for Zentrix Network Graph and Drill Down Network PRO (Pin) by ZoomCharts, and Dec 2025 for Funnel/Pyramid Chart - xViz and Wordlit. All listed alternatives are cloud deployed.
| Name | Pricing | Deployment | Updated |
|---|---|---|---|
| this plugin | Free | Cloud | |
| Zentrix Network Graph | Free | Cloud | |
| Drill Down Network PRO (Pin) by ZoomCharts | Freemium | Cloud | |
| Funnel/Pyramid Chart - xViz | Freemium | Cloud | |
| Wordlit | Paid | Cloud |
657 plugins in Power BI · Analytics
Price distribution: 73 free, 108 freemium, 441 paid, 35 price not published
Zentrix Network Graph renders deterministic node-edge layouts inside Power BI with cross-filtering and graph analytics.
Zentrix Studio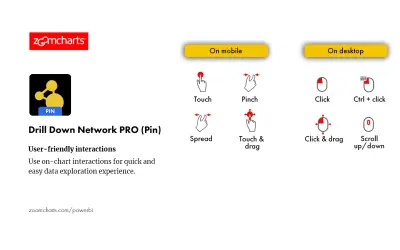
Drill Down Network PRO (Pin) by ZoomCharts renders interactive category-based network charts with drill-down support in Power BI.
ZoomCharts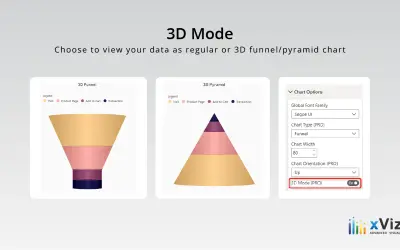
xViz Funnel/Pyramid Chart displays process stages and hierarchies with configurable 2D or 3D views for Power BI reports.
xViz LLC dba Lumel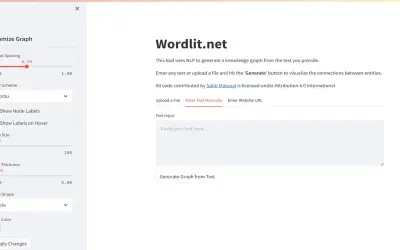
Visualizes NLP text analysis as customizable knowledge graphs showing how words and concepts interrelate, for Streamlit.
Sahir Maharaj«Chord Diagram for Microsoft Power BI by VisioChart In the world of data visualization, the ability to represent complex relationships in an intuitive and visually appealing manner is crucial. Microsoft Power BI, a leading business analytics service, offers a wide range of visualization tools to meet this need. Among …»