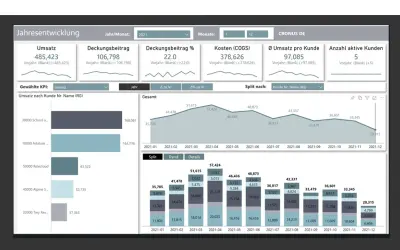
NAVBI Sales
Displays Business Central metrics in dashboards with drilldown from aggregated figures to the transaction level.
navidaPaid
Create customizable waterfall charts in Power BI with variance calculations, totals, sorting, and bar color options.
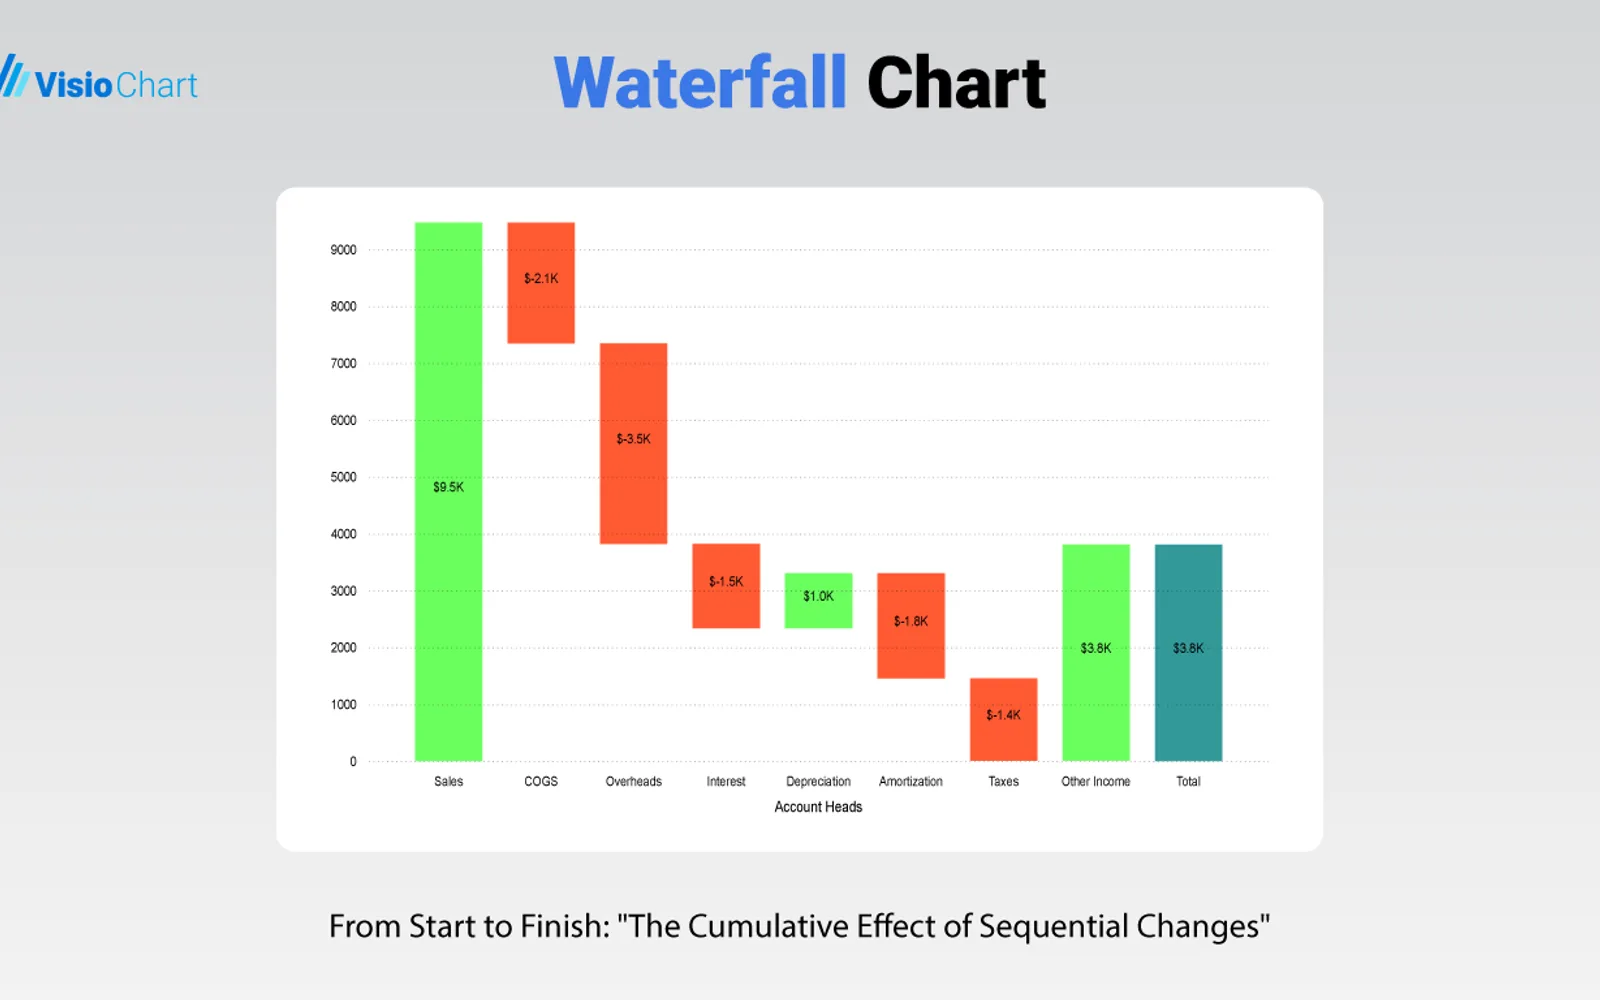
VisioChart adds a waterfall chart visual to Power BI. It displays incremental changes over time and shows how individual factors contribute to an aggregate result. The visual can calculate variances against the previous year, plan, or forecast, along with year-over-year growth rates and totals. Chart settings include number formats, fonts, colors, tooltips, sorting, and responsive display behavior.
Calculates variances against the previous year, plan, or forecast.
Calculates year-over-year growth rates.
Shows incremental changes over time and how factors contribute to an aggregate result.
Supports solid, multi-color, and polarity-based bar colors.
Supports custom number formats, fonts, colors, tooltips, and sort order.
Waterfall Chart is free, while NAVBI Sales and PieChart by iFour are paid. Waterfall Chart uses cloud deployment, as do NAVBI Sales, hi-chart Reporting Studio, Innofalls Charts, PieChart by iFour, and Funnel/Pyramid Chart - xViz. Waterfall Chart was updated on Dec 2025, while NAVBI Sales shows Feb 2026, hi-chart Reporting Studio, Innofalls Charts, and Funnel/Pyramid Chart - xViz show Dec 2025, and PieChart by iFour shows Nov 2025.
| Name | Pricing | Deployment | Updated |
|---|---|---|---|
| this plugin | Free | Cloud | |
| NAVBI Sales | Paid | Cloud | |
| PieChart by iFour | Paid | Cloud | |
| hi-chart Reporting Studio | Freemium | Cloud | |
| Innofalls Charts | Freemium | Cloud | |
| Funnel/Pyramid Chart - xViz | Freemium | Cloud |
657 plugins in Power BI · Analytics
Price distribution: 73 free, 108 freemium, 441 paid, 35 price not published
Displays Business Central metrics in dashboards with drilldown from aggregated figures to the transaction level.
navida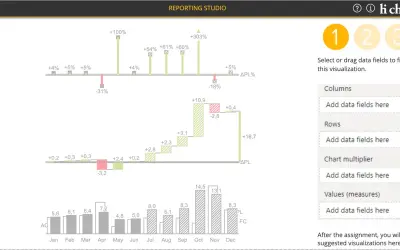
Creates charts, tables and waterfalls in Power BI with a built-in notation concept and automatic variance calculation.
CP Corporate Planning GmbH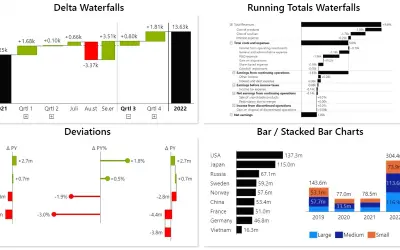
Power BI visual for building waterfall and bar charts through interactive navigation, drill downs, and dynamic comparisons.
Innofalls GmbH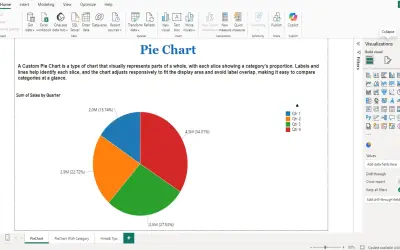
PieChart by iFour divides data into colored slices to visualize parts-to-whole relationships within Power BI reports.
iFour Technolab Pvt. Ltd.«Visualise Your Data with VisioChart Harness the full potential of your data with VisioChart, the ultimate visual tool for Power BI. VisioChart offers an extensive range of advanced charts, making your reports and dashboards informative and visually stunning. VisioChart automates variance calculations (Previous Year …»