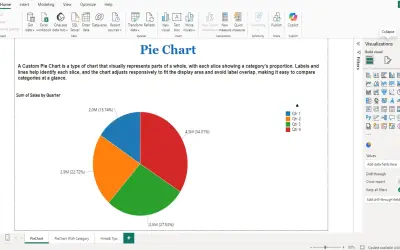
PieChart by iFour
PieChart by iFour divides data into colored slices to visualize parts-to-whole relationships within Power BI reports.
iFour Technolab Pvt. Ltd.Paid
Displays hierarchical information in Power BI with nested circular bands for category levels.
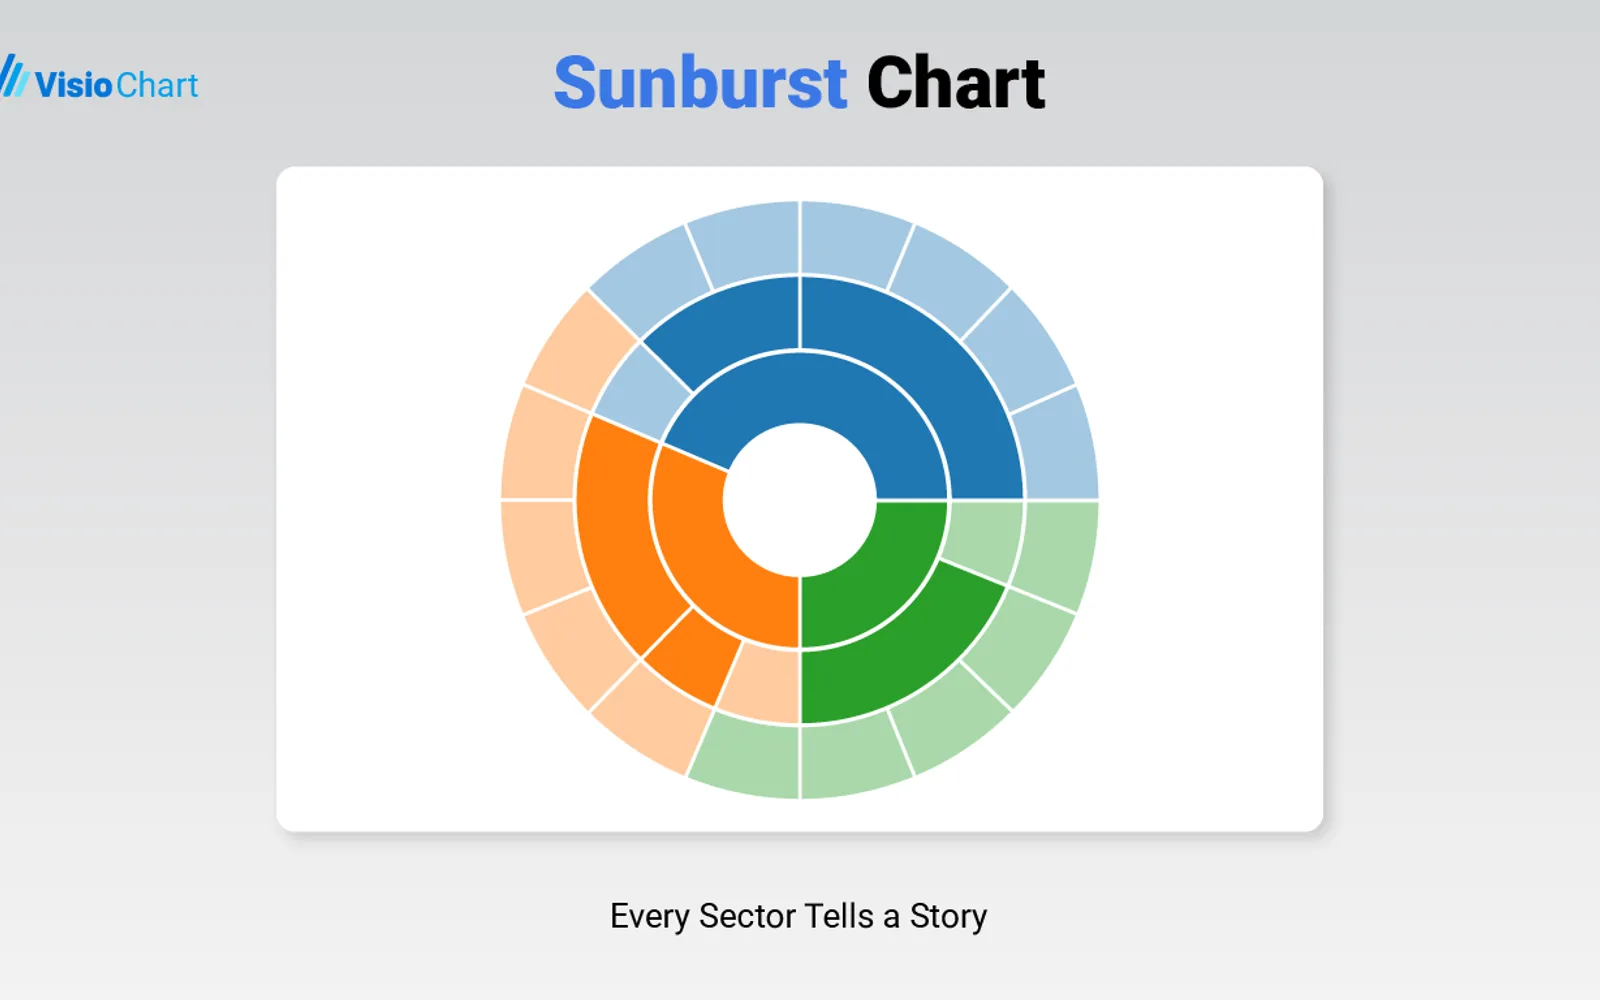
Sunburst Chart presents hierarchical data in Power BI as nested circular bands. It accepts one to five category dimensions and can use one numeric measure to determine segment size. Tooltips, label settings, and color settings are available. The visual does not provide drill-down or drill-through.
Handles between one and five hierarchical category dimensions.
Can use one numeric measure to size segments according to their values.
Places successive hierarchy levels in inner and outer circular bands.
Shows tooltips that provide additional data context.
Provides settings for changing colors and labels.
Runs within the Power BI environment.
Sunburst Chart is freemium and cloud-deployed. PieChart by iFour, Finance Connector for Power BI, Bowtie Chart by MAQ Software, and Wise BC Financial Insights are paid and cloud-deployed. Funnel/Pyramid Chart - xViz is freemium and cloud-deployed.
| Name | Pricing | Deployment | Updated |
|---|---|---|---|
| this plugin | Freemium | Cloud | |
| PieChart by iFour | Paid | Cloud | |
| Finance Connector for Power BI | Paid | Cloud | |
| Bowtie Chart by MAQ Software | Paid | Cloud | |
| Wise BC Financial Insights | Paid | Cloud | |
| Funnel/Pyramid Chart - xViz | Freemium | Cloud |
657 plugins in Power BI · Analytics
Price distribution: 73 free, 108 freemium, 441 paid, 35 price not published
PieChart by iFour divides data into colored slices to visualize parts-to-whole relationships within Power BI reports.
iFour Technolab Pvt. Ltd.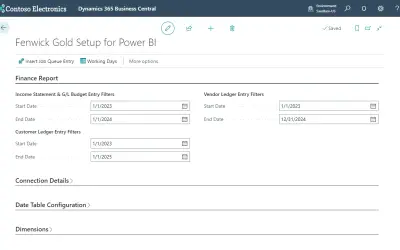
Provides the data connections and system functions required to export Business Central data in a reporting format for Power BI.
Fenwick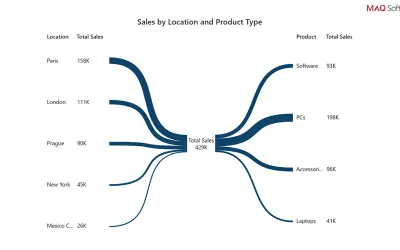
Power BI custom visual that renders data as a bowtie chart, using branch thickness to show each category's relative weight.
MAQ LLC
A Power BI app that provides pre-designed financial reports and KPIs for Microsoft Dynamics 365 Business Central data.
Wise«Sunburst Chart by VisioChart The Sunburst Chart by VisioChart is a highly visual and engaging way to present hierarchical data in Power BI. Designed for simplicity and flexibility, this chart displays categories in a circular, radial layout that helps users easily understand how parts of a hierarchy contribute to the …»