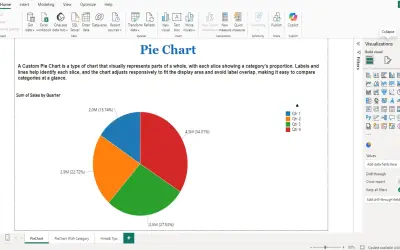
PieChart by iFour
PieChart by iFour divides data into colored slices to visualize parts-to-whole relationships within Power BI reports.
iFour Technolab Pvt. Ltd.Paid
Visualizes categorical data in Power BI using angular width and radial length for two numerical metrics.
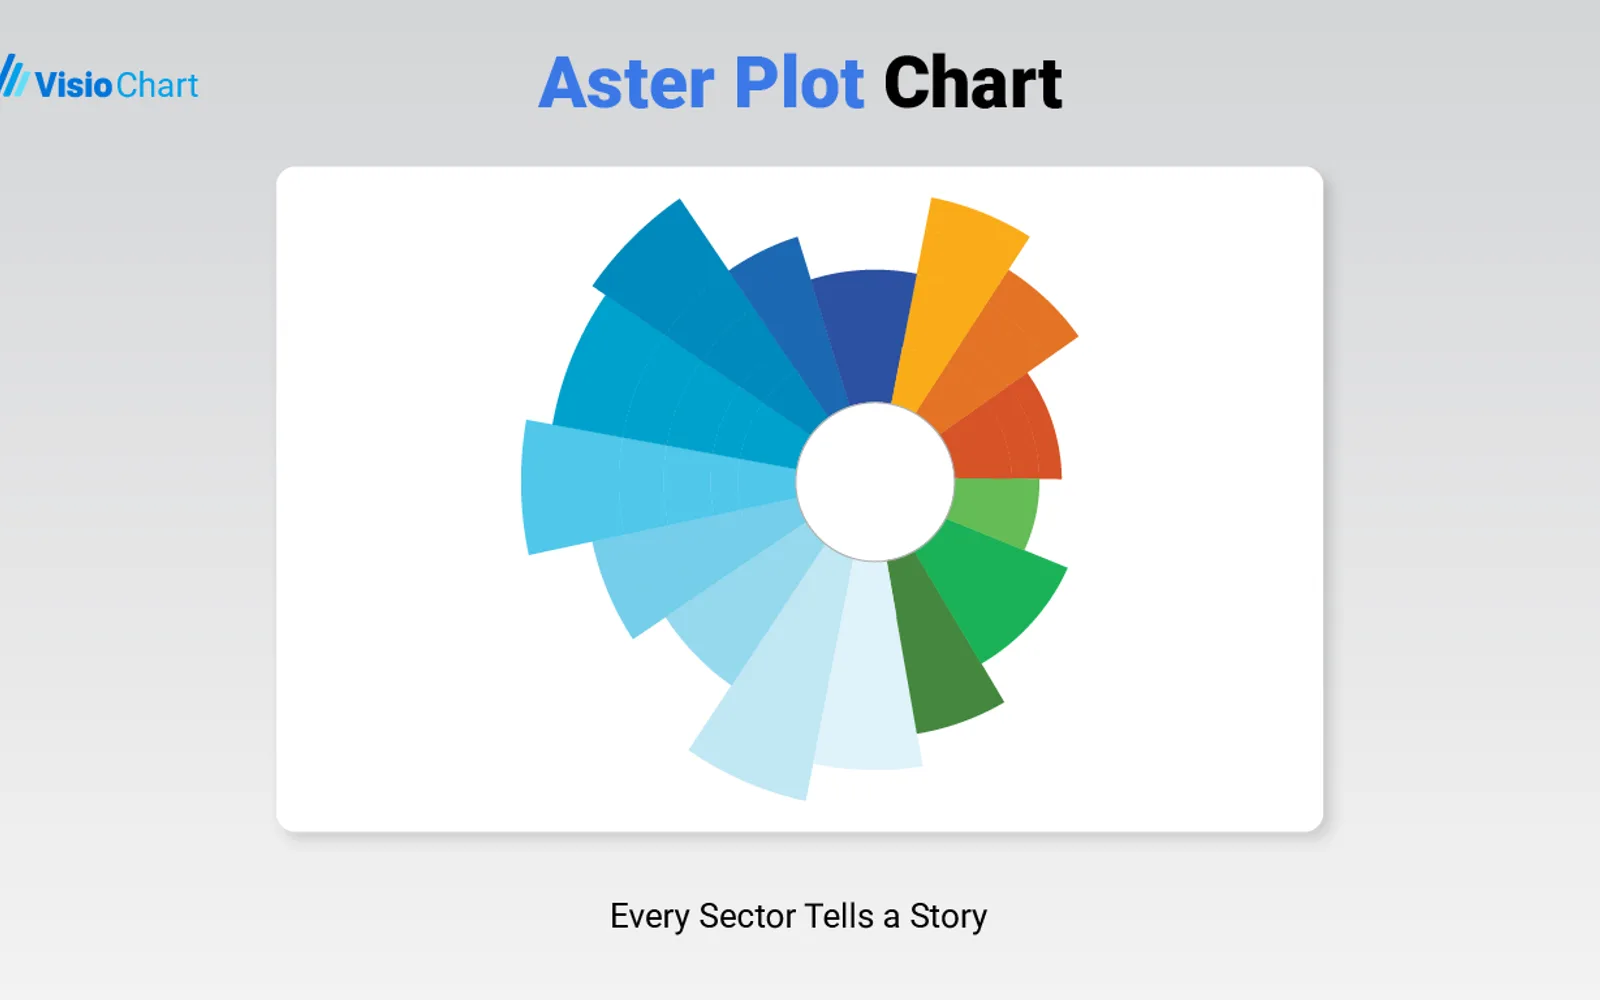
Aster Plot Chart displays categorical data with angular width and radial length. Categories appear as wedges, with angle and radius representing metric values or relative weight. The visual supports formatting for colors, labels, tooltips, legends, sorting, and radius scaling. It responds to Power BI slicers, filters, and drillthrough actions.
Represents numerical data through both angular width and radial length.
Supports configurable colors, labels, tooltips, legends, sorting, and radius scaling.
Responds to slicers, filters, and drillthrough actions in Power BI.
Uses one category dimension and one measure in the visual field wells.
Aster Plot Chart is freemium, while PieChart by iFour, Progress Icon, and Bowtie Chart by MAQ Software are paid, and Ridgeline Plot by Powerviz is free. Advanced Pie and Donut - xViz is also freemium. All listed alternatives use cloud deployment. Aster Plot Chart was updated on Dec 2025; the alternatives list shows update dates from Nov 2025 through Jul 2026.
| Name | Pricing | Deployment | Updated |
|---|---|---|---|
| this plugin | Freemium | Cloud | |
| Aster Plot | Paid | Cloud | |
| PieChart by iFour | Paid | Cloud | |
| Progress Icon | Paid | Cloud | |
| Bowtie Chart by MAQ Software | Paid | Cloud | |
| Ridgeline Plot by Powerviz | Free | Cloud | |
| Advanced Pie and Donut - xViz | Freemium | Cloud |
657 plugins in Power BI · Analytics
Price distribution: 73 free, 108 freemium, 441 paid, 35 price not published
PieChart by iFour divides data into colored slices to visualize parts-to-whole relationships within Power BI reports.
iFour Technolab Pvt. Ltd.
Power BI custom visual that fills an SVG icon to show KPI progress toward a target instead of a plain number on a card.
NeenOpal Inc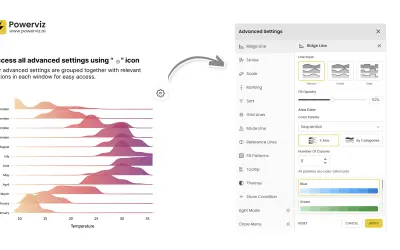
Custom Power BI visual that plots numeric distributions for multiple categories as stacked curves along a common continuous axis.
TRUVIZ INC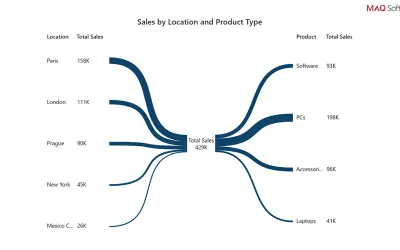
Power BI custom visual that renders data as a bowtie chart, using branch thickness to show each category's relative weight.
MAQ LLC«The Aster Plot is a unique and visually engaging custom visual for Power BI that combines aspects of both pie charts and radial bar charts. It enables users to visualize categorical data with two numerical metrics simultaneously—one represented by angle and the other by radius—providing a multi-dimensional way to …»