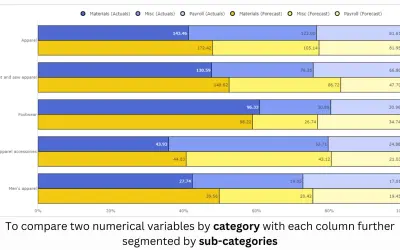
100% Clustered Stacked Bar Chart (Pro)
100% Clustered Stacked Bar Chart (Pro) renders conditional formatting and small multiples for Power BI reports.
PBIVizEdit.comFreemiumCompare
Teams · Power Platform
Apps that extend Teams, SharePoint, Power Apps, and other Microsoft 365 products. Every card records the pricing, deployment, and fact fields the vendor publishes, with the date we checked them.
100% Clustered Stacked Bar Chart (Pro) renders conditional formatting and small multiples for Power BI reports.
PBIVizEdit.com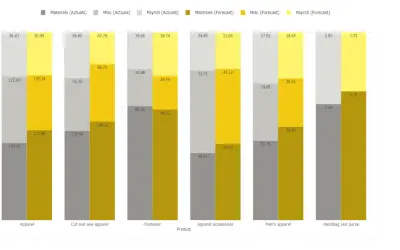
Compares multiple data series grouped by category with columns summing to 100% in Power BI Pro and Premium platforms.
PBIVizEdit.com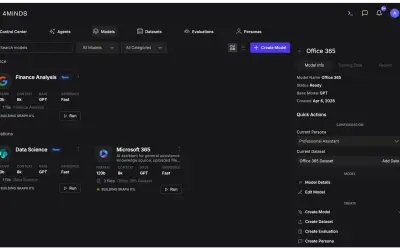
4MINDS deploys single-tenant custom language models in Azure using open-source models and a proprietary adapter.
4MindsAI Inc.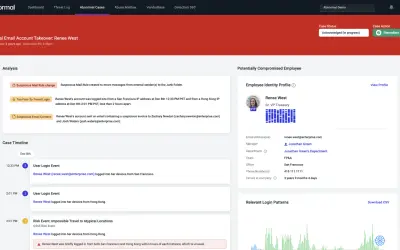
For Abnormal AI, automates phishing simulations, just-in-time AI coaching, and annual training based on attacks in Threat Log.
Abnormal Security Corporation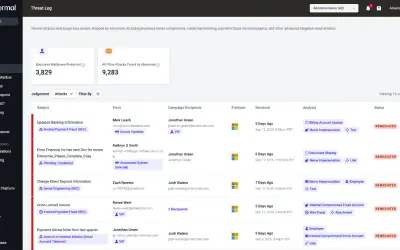
Abnormal AI uses behavioral modeling to block advanced email attacks and automate remediation across Microsoft 365 tenants.
Abnormal Security Corporation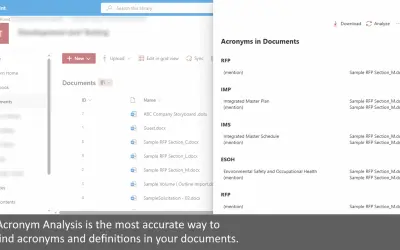
Searches all documents in a SharePoint document library for acronyms and definitions, with results viewable in the web or Excel.
XRSolutions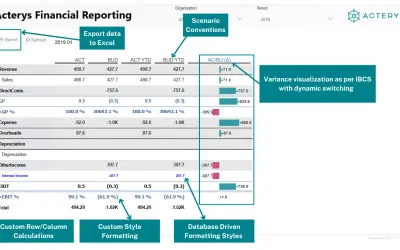
Builds IBCS-compliant financial reports in Power BI with custom calculations, automated formatting, and variance visuals.
Managility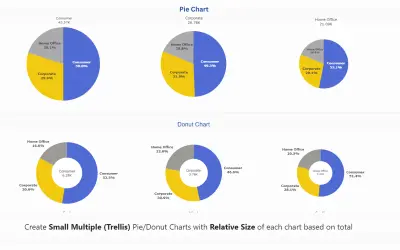
Advanced Donut and Pie Chart (Pro) provides trellis layouts, custom sorting, and conditional color formatting for Power BI.
PBIVizEdit.com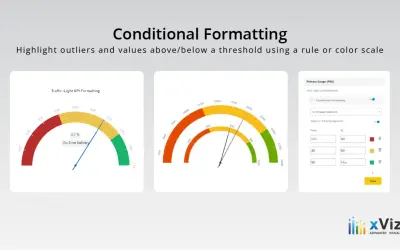
Advanced Gauge - xViz displays one or more data values against defined ranges using configurable gauge layouts for Power BI.
xViz LLC dba Lumel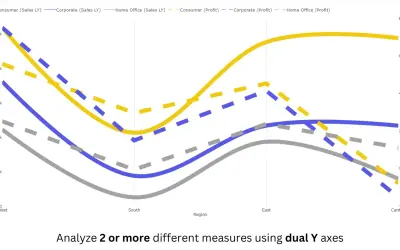
Power BI line chart visual with small multiples, reference and error bands, and categorical data on both X and Y axes.
PBIVizEdit.com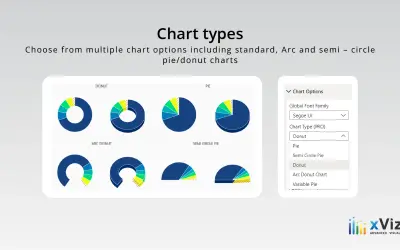
An xViz pie and donut chart for Power BI that compares parameters and displays each part's proportion of the whole.
xViz LLC dba Lumel
Aimey.ai transcribes meetings, generates summaries, and extracts insights for Microsoft Teams and Azure environments.
Aimey.ai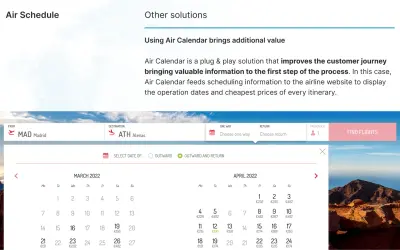
Air Schedule enables airlines and partners to export flight data into easy-to-read JSON format, using SSM/ASM and SSIM standards.
AIRPLANE SOLUTIONS S.L.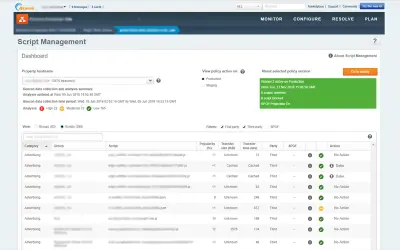
Ion delivers automated performance optimizations for web, iOS, and Android apps on the Akamai Intelligent Edge Platform.
Akamai Technologies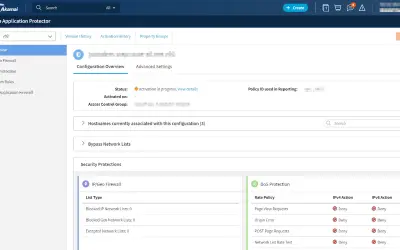
Akamai Web Application Protector provides automated WAF and DDoS protections with curated rules for securing web applications.
Akamai Technologies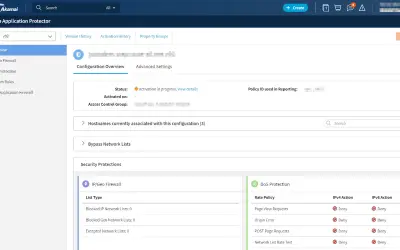
Web Application Protector offers automated WAF and DDoS protections that simplify the task of securing your web applications.
Akamai Technologies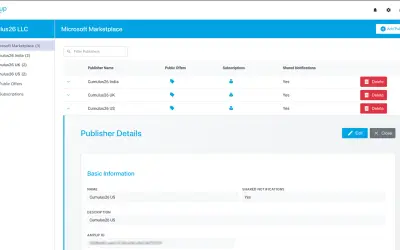
Manages the complete lifecycle of Microsoft Marketplace SaaS offers, from activation through renewal, for software publishers.
Cumulus26 US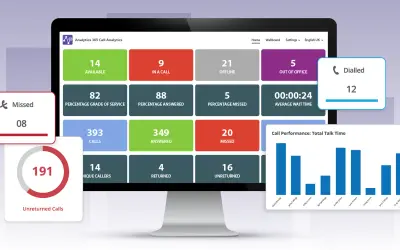
Provides call analytics for Microsoft Teams, giving companies insights into call activity, staffing levels, and performance.
Tollring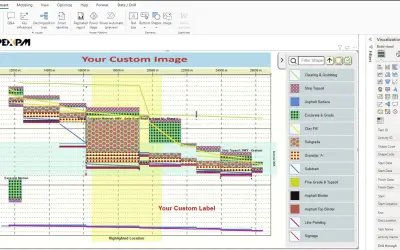
Apex Linear Schedule converts complex project schedules into Time-Location format charts within Microsoft Power BI.
APEX Project Management Inc.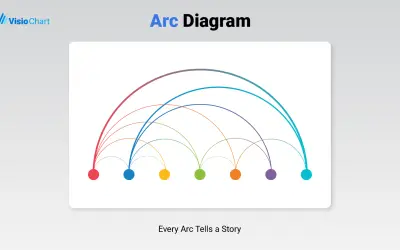
Places nodes on a single axis and connects related pairs with arcs whose size can reflect a numeric measure of strength.
VisioChart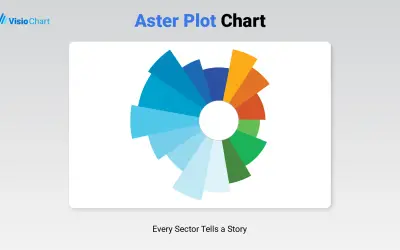
Visualizes categorical data in Power BI using two measures at once, with one shown by angle and the other by radius.
VisioChart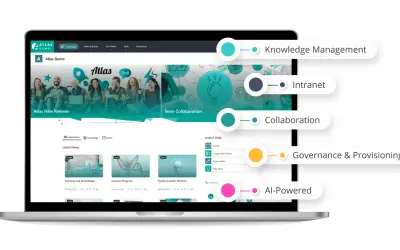
Atlas Intelligent Knowledge Platform combines knowledge management, governance, and AI tools within Microsoft 365 environments.
ClearPeopleThis section of the catalog lists 8,131 apps for Microsoft 365 / Teams / Power Platform. Every fact on a card is extracted from the app's listing on the official marketplace and carries the date we checked it; where the vendor publishes nothing, the card says so instead of guessing.
Pricing as published by vendors: 260 listed as free, 260 as freemium, 3,413 as paid, 4,198 without a published price. Use the filters above to narrow the list by category, pricing, or deployment.
These Microsoft 365 / Teams / Power Platform listings carry the most detail in this catalog, ranked by a catalog data score: the length and completeness of the marketplace listing text, the number of recorded fact fields, and a hosted screenshot. This measures documentation, not quality — it is not a recommendation.