
Bullet Chart - xViz
Power BI visual for comparing actuals against targets, with IBCS-certified bullet chart templates and comparison bands.
xViz LLC dba LumelFreemium
Create customizable line charts in Power BI with sorting, formatting, categorical axes, analytics overlays, and small multiples.
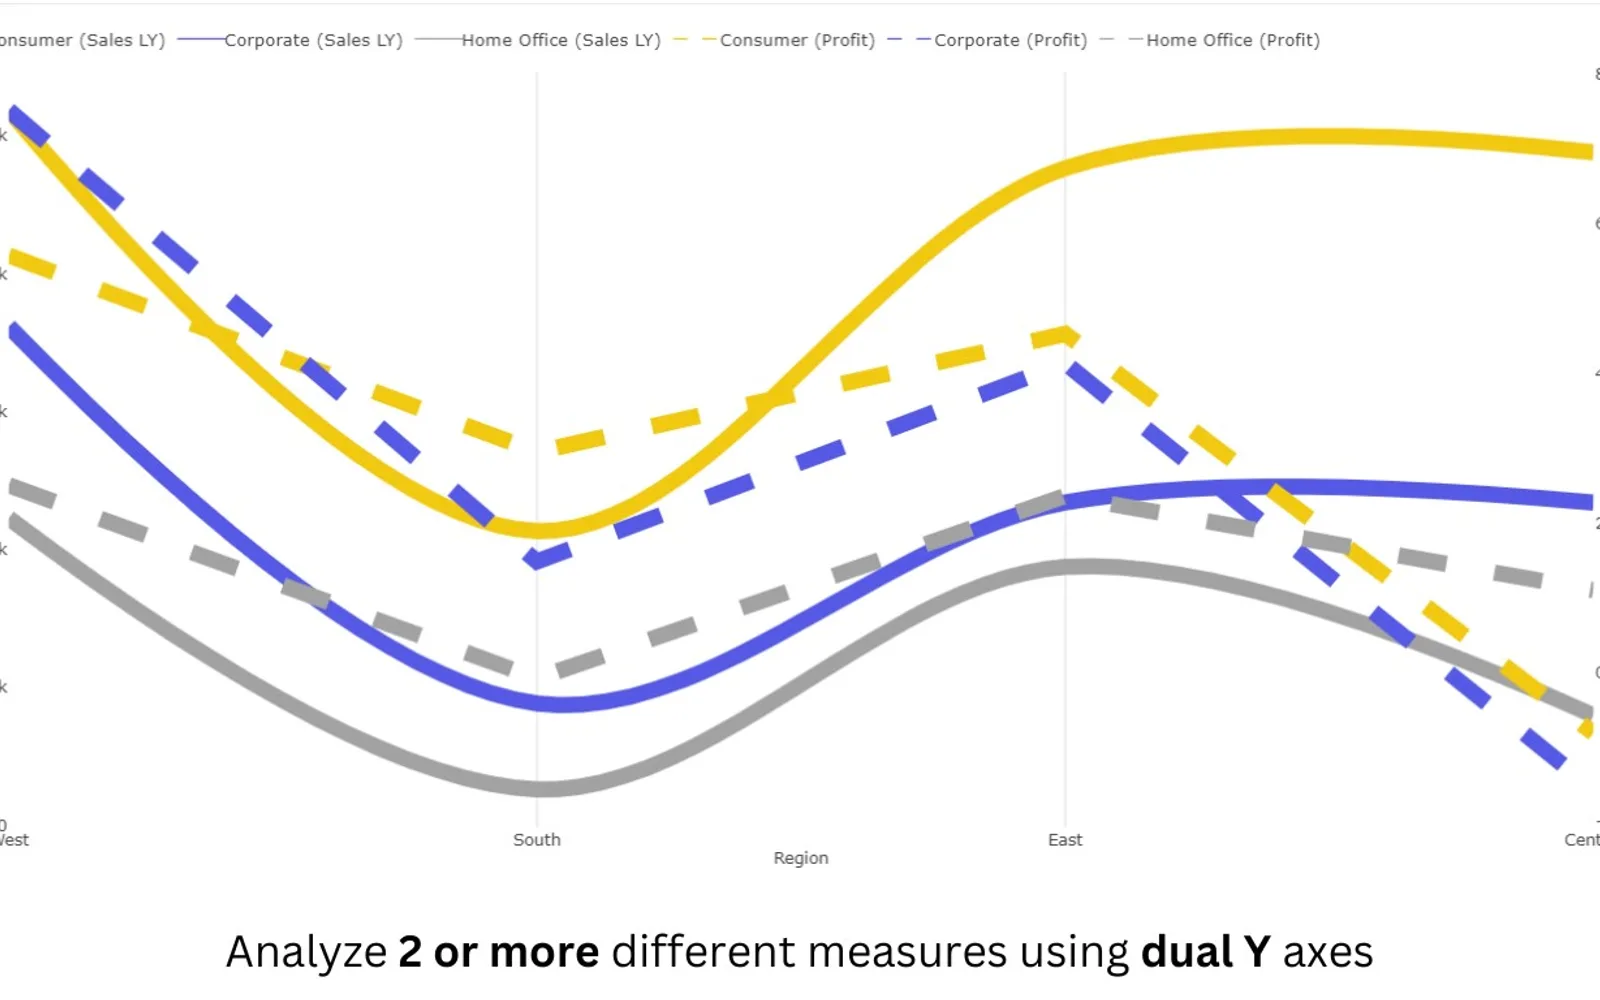
Provides a line chart visual for Power BI with custom sorting, conditional formatting, categorical data mapping on both axes, and small multiples. An analytics panel includes reference bands, reference lines, error bands, and error bars. Line and marker properties can be modified by size, color, transparency, style, and shape. The listing covers Power BI Desktop, Web, Mobile, SharePoint embedding, and internal application embedding with a per-user license.
The visual supports custom sorting.
The visual supports conditional formatting.
Categorical data can be mapped to both the X and Y axes.
The analytics panel provides reference bands, reference lines, error bands, and error bars.
The visual supports small multiples.
Line and marker properties can be modified by size, color, transparency, style, and shape.
Advanced Line Chart (Pro) and Bullet Chart - xViz both use freemium pricing and cloud deployment. Multi Line Chart with Tooltips uses paid pricing and cloud deployment, while Advanced Line Chart (Pro) uses freemium pricing. Drill Down Combo PRO (Pin) by ZoomCharts, Lollipop Column Chart, and Drill Down Combo Bar PRO (Filter) by ZoomCharts are also listed with freemium pricing and cloud deployment.
| Name | Pricing | Deployment | Updated |
|---|---|---|---|
| this plugin | Freemium | Cloud | |
| Bullet Chart - xViz | Freemium | Cloud | |
| Multi Line Chart with Tooltips | Paid | Cloud | |
| Drill Down Combo PRO (Pin) by ZoomCharts | Freemium | Cloud | |
| Lollipop Column Chart | Freemium | Cloud | |
| Drill Down Combo Bar PRO (Filter) by ZoomCharts | Freemium | Cloud |
877 plugins in Power BI · Analytics
Price distribution: 74 free, 113 freemium, 497 paid, 193 price not published
Power BI visual for comparing actuals against targets, with IBCS-certified bullet chart templates and comparison bands.
xViz LLC dba Lumel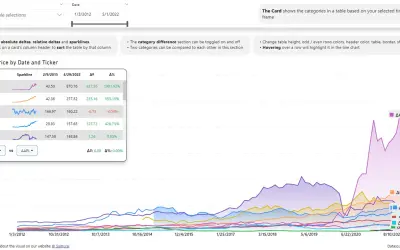
Power BI visual that compares categories over time, with YoY, MoM, YTD and MTD calculations, deltas and sparklines.
Datanauts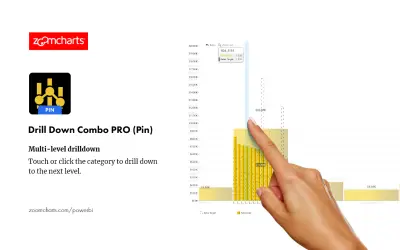
Adds column, line, and area chart types per series to Power BI dashboards, with stacking, clustering, and thresholds.
ZoomCharts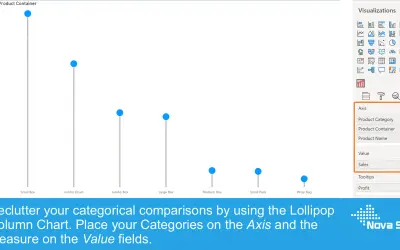
Lollipop Column Chart displays a marker and line per category as an alternative to standard column charts in Power BI.
Nova Silva«Description FEATURES AVAILABLE • Custom Sorting • Conditional formatting • Map Categorical data in both X and Y axes • Analytics Panel - Reference bands and line, Error bands and bars • Small Multiple • Modify line and marker based on size, color, transparency, style, shape etc. License Details Power BI Platforms Get …»